728x90
반응형
SMALL
SVM 회귀
SVM을 회귀에 적용하는 방법은 제한된 마진 오류 (도로 밖 샘플) 안에서 도로 안에 가능한 많은 샘플이 들어가도록 학습한다. 도로 폭은 하이퍼파라미터 ϵ로 조절한다. 마진 안에서 훈련 샘플이 추가되어도 모델의 예측에는 영향이 없게 되면, ϵ에 민감하지 않다고 한다.
from sklearn.svm import LinearSVR

svm_reg = LinearSVR(epsilon=1.5)
svm_reg.fit(X, y)

LinearSVR(C=1.0, dual=True, epsilon=1.5, fit_intercept=True,
          intercept_scaling=1.0, loss='epsilon_insensitive', max_iter=1000,
          random_state=None, tol=0.0001, verbose=0)

np.random.seed(42)

m = 50
X = 2 * np.random.rand(m, 1)
y = (4 + 3 * X + np.random.randn(m, 1)).ravel()
eps_x1 = 1
eps_y_pred = svm_reg.predict([[eps_x1]])

# 입실론에 따른 결정 경계 차이를 확인하기 위해 ε = 1.5 , 0.5 두 모델 생성
svm_reg1 = LinearSVR(epsilon=1.5, random_state = 42)
svm_reg1.fit(X,y)

svm_reg2 = LinearSVR(epsilon=0.5, random_state=42)
svm_reg2.fit(X,y)

def find_support_vector(svm_reg, X, y):
    y_pred = svm_reg.predict(X)
    off_margin = (np.abs(y - y_pred) >= svm_reg.epsilon)
    # abs : 절대값
    return np.argwhere(off_margin)
    # argwhere : 해당 데이터의 위치

svm_reg1.support_ = find_support_vector(svm_reg1, X, y)
svm_reg2.support_ = find_support_vector(svm_reg2, X, y)

def plot_svm_regression(svm_reg, X, y, axes):
    xls = np.linspace(axes[0], axes[1], 100).reshape(100, 1)
    y_pred = svm_reg.predict(xls)
    plt.plot(xls, y_pred, "k-", linewidth = 2, label=r"$\hat{y}$")
    plt.plot(xls, y_pred + svm_reg.epsilon, "k--")
    plt.plot(xls, y_pred - svm_reg.epsilon, "k--")
    plt.scatter(X[svm_reg.support_], y[svm_reg.support_], s=180,
    facecolors="#FFAAAA")
    plt.plot(X, y, "bo")
    plt.xlabel(r"$x_1$", fontsize=18)
    plt.legend(loc='upper left', fontsize=18)
    plt.axis(axes)
fig, axes = plt.subplots(ncols=2, figsize=(9, 4), sharey = True)
plt.sca(axes[0])
plot_svm_regression(svm_reg1, X, y, [0, 2, 3, 11])
plt.title(r"$\epsilon = {}$".format(svm_reg1.epsilon), fontsize=18)
plt.ylabel(r"$y$", fontsize=18, rotation=0)
plt.annotate('', xy=(eps_x1, eps_y_pred), xycoords = 'data',
xytext=(eps_x1, eps_y_pred - svm_reg1.epsilon),
textcoords = 'data', arrowprops = {'arrowstyle' : "<->", 'linewidth' : 1.5}
)
plt.text(0.91, 5.6, r"$\epsilon$", fontsize=20)
plt.sca(axes[1])
plot_svm_regression(svm_reg2, X, y, [0, 2, 3, 11])
plt.title(r"$\epsilon = {}$".format(svm_reg2.epsilon), fontsize=18)
plt.show()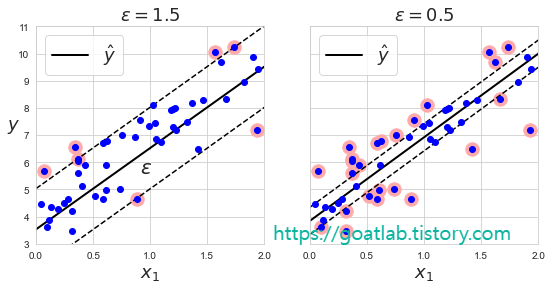
심장마비 위험이 높은 환자 분류
|
import pandas as pd
import numpy as np
import matplotlib.pyplot as plt
import seaborn as sns
from sklearn.preprocessing import RobustScaler
from sklearn.model_selection import train_test_split

from sklearn.svm import SVC
from sklearn.linear_model import LogisticRegression
from sklearn.ensemble import RandomForestClassifier
from sklearn.tree import DecisionTreeClassifier

# Metrics
from sklearn.metrics import accuracy_score, classification_report, roc_curve

# Cross Validation
from sklearn.model_selection import cross_val_score
from sklearn.model_selection import GridSearchCV

df = pd.read_csv("./heart_attack.csv")
df.head(3)
df.info()df1 = df
# define the columns to be encoded and scaled
cat_cols = ['sex','exng','caa','cp','fbs','restecg','slp','thall']
con_cols = ["age","trtbps","chol","thalachh","oldpeak"]
# encoding the categorical columns
df1 = pd.get_dummies(df1, columns = cat_cols, drop_first = True)
# defining the features and target
X = df1.drop(['output'],axis=1)
y = df1[['output']]
# instantiating the scaler
scaler = RobustScaler()
# scaling the continuous featuree
X[con_cols] = scaler.fit_transform(X[con_cols])
print("The first 5 rows of X are")
X.head()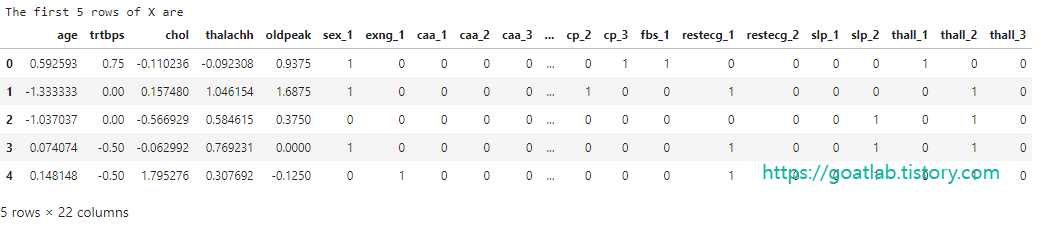
X_train, X_test, y_train, y_test = train_test_split(X, y, test_size = 0.2, random_state = 42)

print("The shape of X_train is      ", X_train.shape)
print("The shape of X_test is       ", X_test.shape)
print("The shape of y_train is      ", y_train.shape)
print("The shape of y_test is       ", y_test.shape)
dt = DecisionTreeClassifier(random_state = 42)
dt.fit(X_train, y_train)
y_pred = dt.predict(X_test)
print("The test accuracy score of Decision Tree is ", accuracy_score(y_test, y_pred))rf = RandomForestClassifier(n_estimators=1000, max_depth=5, random_state = 42)
rf.fit(X_train, y_train)
y_pred = rf.predict(X_test)
print("The test accuracy score of Random Forest is ", accuracy_score(y_test, y_pred))svc_clf = SVC(kernel='linear', C=1, random_state=42).fit(X_train,y_train)
y_pred = svc_clf.predict(X_test)
print("The test accuracy score of SVM is ", accuracy_score(y_test, y_pred))log_reg = LogisticRegression(random_state=42)
log_reg.fit(X_train, y_train)
y_pred_proba = log_reg.predict_proba(X_test)
y_pred = np.argmax(y_pred_proba,axis=1)
print("The test accuracy score of Logistric Regression is ", accuracy_score(y_test, y_pred))728x90
반응형
LIST
'Learning-driven Methodology > ML (Machine Learning)' 카테고리의 다른 글
| [Machine Learning] 앙상블 (Ensemble) (0) | 2022.10.04 |
|---|---|
| [Machine Learning] LightGBM (0) | 2022.10.04 |
| [Machine Learning] 비선형 SVM 분류 (0) | 2022.09.30 |
| [LightGBM] 매개변수 조정 (Parameters Tuning) (2) (0) | 2022.07.04 |
| [LightGBM] 매개변수 조정 (Parameters Tuning) (1) (0) | 2022.06.28 |


