Noisy ECG 신호 분석
HeartPy를 사용하여 특히 노이즈가 많은 심전도 신호를 분석하는 방법이 있다. 심전도 분석에서 전처리 단계는 피크 형태에 차이가 있기 때문에 PPG 신호와 약간 다르지만 일반적인 분석은 동일한 방식으로 처리된다.
MIT-BIH Noise 스트레스 테스트 데이터 세트의 데이터를 사용한다.
이 데이터는 wfdb 패키지와 함께 로드되어야 하지만, 사용하기 쉽도록 4개의 파일을 .csv 데이터로 변환했다. 모든 파일이 360Hz로 기록된다.
SNR (Signal-to-Noise) 비율이 다양한 다음 파일을 사용한다.
|
이 파일에는 잡음 섹션과 잡음 섹션이 있다. 다운로드 크기를 낮게 유지하기 위해 작업할 노이즈가 있는 세그먼트의 2분 섹션을 추출했다.
import matplotlib.pyplot as plt
import numpy as np
import heartpy as hp
sample_rate = 360
def load_visualise(data_file, annotations_file):
'''
loads data and annotations, plots them
and returns data and annotations
'''
# load the data
ecg = hp.get_data(data_file)
# get the annotations
annotations = hp.get_data(annotations_file)
# explore signal
plt.figure(figsize=(12,3))
plt.plot(ecg)
plt.scatter(annotations, [ecg[int(x)] for x in annotations], color='green')
plt.show()
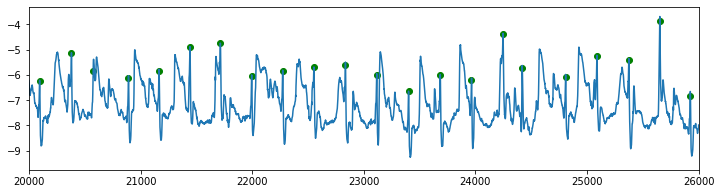
# and zoom in
plt.figure(figsize=(12,3))
plt.plot(ecg)
plt.scatter(annotations, [ecg[int(x)] for x in annotations], color='green')
plt.xlim(20000, 26000)
plt.show()
return ecg, annotations
ecg, annotations = load_visualise('118e24.csv', '118e24_ann.csv')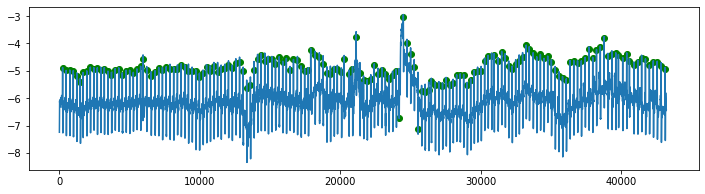
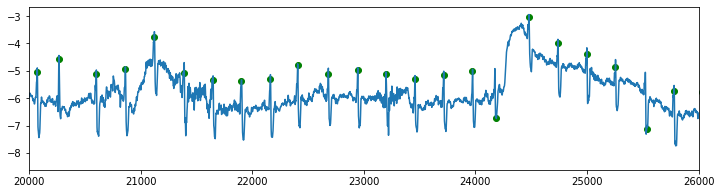
데이터 세트와 함께 제공된 주석에는 작은 오류가 있다. 이는 일반적으로 이러한 주석이 달린 방식 때문이다. 피크는 필요한 경우 자동으로 표시되고 수동으로 수정된다. 엄청난 양의 작업 (심전도 1시간에는 평균 3600개의 피크가 이미 포함됨)으로 인해 작은 오류는 일반적으로 허용되는 것으로 간주되고 남아 있다. 이상한 위치의 피크만 보정된다.
작은 소음 피크가 하나 있고 큰 소음 피크가 하나 있지만 그렇지 않으면 많은 소음이 발생하지 않습니다. 이를 분석하는 것은 비교적 간단해야 한다. 여기서 가장 큰 문제는 기준선 변동 (baseline wander)으로 요약될 수 있다.
HeartPy는 hp.remove_module_module(data, sample_rate, cutoff=0.05)에 위치한 함수와 함께 제공된다. 좁은 주파수 범위 (기본값 : 0.05Hz) 주위에 노치 필터를 적용한다. 이것은 기준선 방황을 제거하지만 위상 이동을 도입하지 않으며, 이는 QRS 복합체와 피크가 정확히 우리가 원하는 동일한 위치에 유지된다는 것을 의미한다.
def filter_and_visualise(data, sample_rate):
'''
function that filters using remove_baseline_wander
and visualises result
'''
filtered = hp.remove_baseline_wander(data, sample_rate)
plt.figure(figsize=(12,3))
plt.title('signal with baseline wander removed')
plt.plot(filtered)
plt.show()
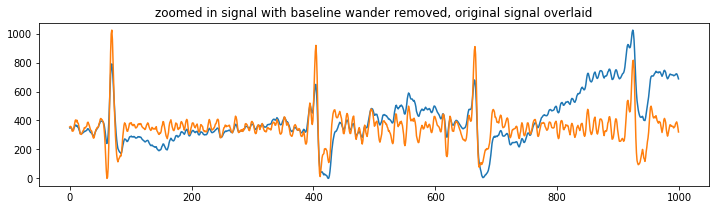
# And let's plot both original and filtered signal, and zoom in to show peaks are not moved
# We'll also scale both signals with hp.scale_data
# This is so that they have the same amplitude so that the overlap is better visible
plt.figure(figsize=(12,3))
plt.title('zoomed in signal with baseline wander removed, original signal overlaid')
plt.plot(hp.scale_data(data[200:1200]))
plt.plot(hp.scale_data(filtered[200:1200]))
plt.show()
return filtered
filtered = filter_and_visualise(ecg, sample_rate)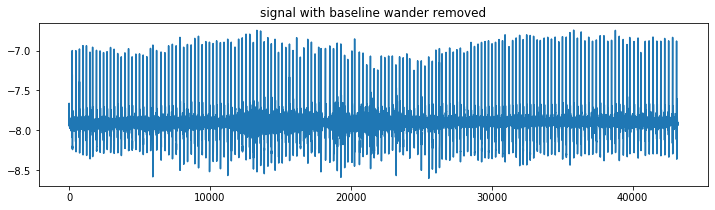
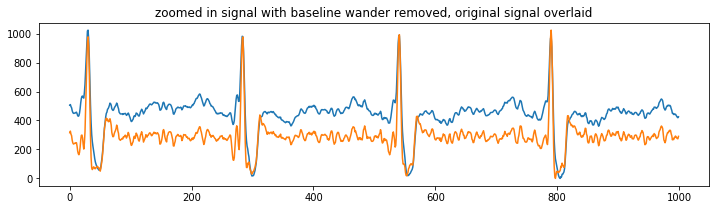
필터링을 하고 피크 위치가 이동하기 시작하는 것을 관찰할 경우 측정값에 노이즈가 유입되는지 주의해야 한다. HRV 측정은 특이치에 특히 민감하다.
모든 피크의 위상 편이가 비슷하지만 최대 위치가 바뀌도록 모양을 바꾸기 시작하면 문제가 발생할 수 있다.
이제 분석을 실행한다. hp.scale_data()를 사용하여 필터링한 후 데이터를 스케일링하여 진폭을 표준화한다. 이것은 선형 연산이기 때문에 데이터의 시간적 위치에 영향을 주지 않는다.
wd, m = hp.process(hp.scale_data(filtered), sample_rate)

plt.figure(figsize=(12,4))
hp.plotter(wd, m)

for measure in m.keys():
    print('%s: %f' %(measure, m[measure]))

# plot poincare
hp.plot_poincare(wd, m)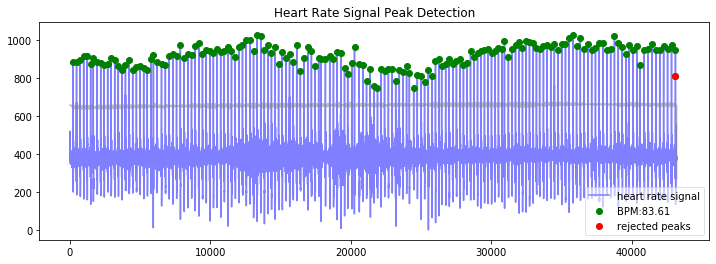
bpm: 83.607704
ibi: 717.637216
sdnn: 63.436841
sdsd: 84.003620
rmssd: 97.965175
pnn20: 0.381818
pnn50: 0.218182
hr_mad: 20.833333
sd1: 69.271148
sd2: 57.234682
s: 12455.510575
sd1/sd2: 1.210300
breathingrate: 0.358333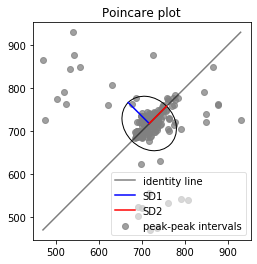
SNR 또는 12dB로 넘어간다.
ecg, annotations = load_visualise('118e12.csv', '118e12_ann.csv')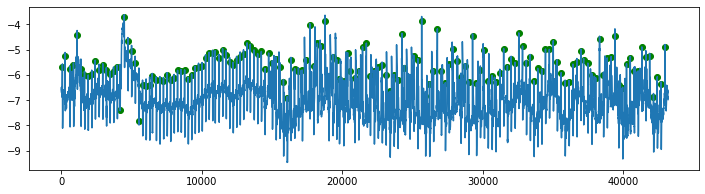
좀 더 어려워지고 있지만, 심전도 파형은 여전히 신호에서 꽤 볼 수 있다. 기준선 변동 외에도 remove_baseline_wander는 신호의 더 낮은 주파수 노이즈에도 (적게) 반응한다. 이렇게 하면 신호가 충분히 정리될 수 있다.
filtered = filter_and_visualise(ecg, sample_rate)

wd, m = hp.process(hp.scale_data(filtered), sample_rate)

plt.figure(figsize=(12,4))
hp.plotter(wd, m)

for measure in m.keys():
    print('%s: %f' %(measure, m[measure]))

# plot poincare
hp.plot_poincare(wd, m)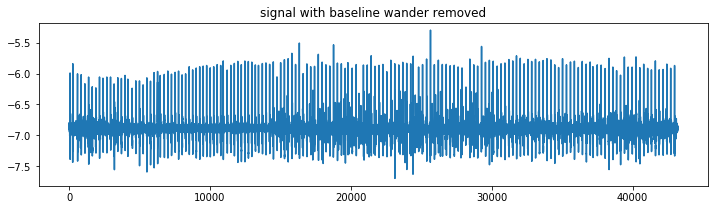
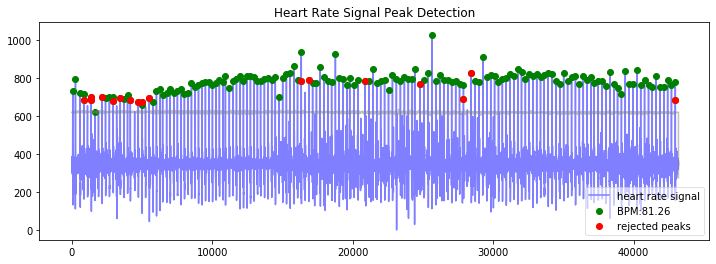
bpm: 81.264108
ibi: 738.333333
sdnn: 62.972766
sdsd: 74.492314
rmssd: 83.750777
pnn20: 0.259843
pnn50: 0.149606
hr_mad: 19.444444
sd1: 59.205804
sd2: 60.887313
s: 11325.071810
sd1/sd2: 0.972383
breathingrate: 0.258333
GitHub - paulvangentcom/heartrate_analysis_python: Python Heart Rate Analysis Package, for both PPG and ECG signals
Python Heart Rate Analysis Package, for both PPG and ECG signals - GitHub - paulvangentcom/heartrate_analysis_python: Python Heart Rate Analysis Package, for both PPG and ECG signals
github.com
'Python Library > HeartPy' 카테고리의 다른 글
| [HeartPy] Colorblind mode (1) (0) | 2022.08.25 |
|---|---|
| [HeartPy] Noisy ECG 신호 분석 (2) (0) | 2022.08.25 |
| [HeartPy] 스마트 링 PPG 신호 분석 (0) | 2022.08.24 |
| [HeartPy] 스마트 워치 PPG 신호 분석 (2) (0) | 2022.08.24 |
| [HeartPy] 스마트 워치 PPG 신호 분석 (1) (3) | 2022.08.24 |


