스마트 링 PPG 신호 분석
최근 시장을 강타한 다양한 스마트 반지가 있다. 무엇보다도 그들은 손가락에 PPG 신호를 기록하기 때문에, HeartPy로 이것들을 분석하는 방법이 있다.
예제 파일에는 파일 크기를 낮게 유지하기 위해 PPG 신호만 포함되어 있다. 많은 스마트 링은 또한 피부 반응, acceleration 및 gyroscopic 데이터를 기록한다. 32Hz로 기록되었다.
# Let's import some packages first
import numpy as np
import matplotlib.pyplot as plt

import heartpy as hp

sample_rate = 32
# load the example file
data = hp.get_data('ring_data.csv')

plt.figure(figsize=(12,6))
plt.plot(data)
plt.show()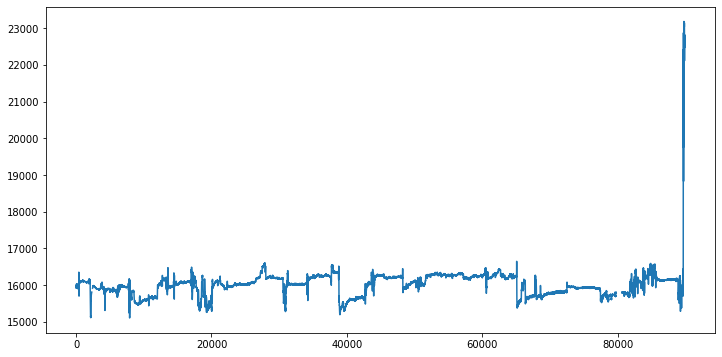
이는 장치가 NaN 값을 출력하는 기간을 의미한다. 숫자 데이터 (0)로 대체한다. 그렇지 않으면 분석의 일부 숫자 부분이 실패한다.
또한, 처음 5분을 플롯하여 신호를 살펴 본다.
# missing pieces! Let's replace
data = np.nan_to_num(data)

# plot first 5 minutes
plt.figure(figsize=(12,6))
plt.plot(data[0:(5 * 60) * sample_rate])
plt.ylim(15000, 17000)
plt.show()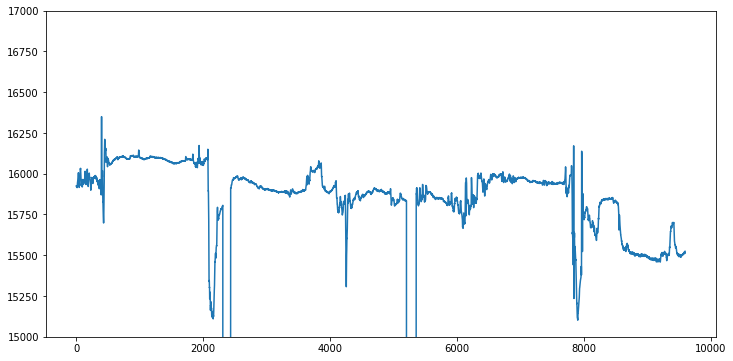
별로 신호가 가는 것 같지 않으므로 두 번째 5분으로 가서 조금 확대한다.
plt.figure(figsize=(12,6))
plt.plot(data[(5 * 60) * sample_rate:(10 * 60) * sample_rate])
plt.show()

plt.figure(figsize=(12,6))
plt.title('zoomed in!')
plt.plot(data[(5 * 60) * sample_rate:(6 * 60) * sample_rate])
plt.show()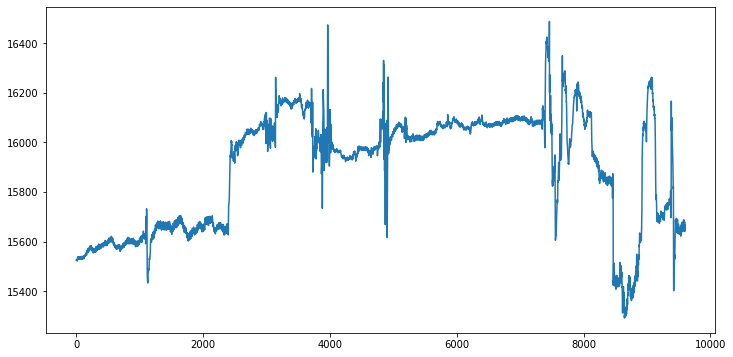
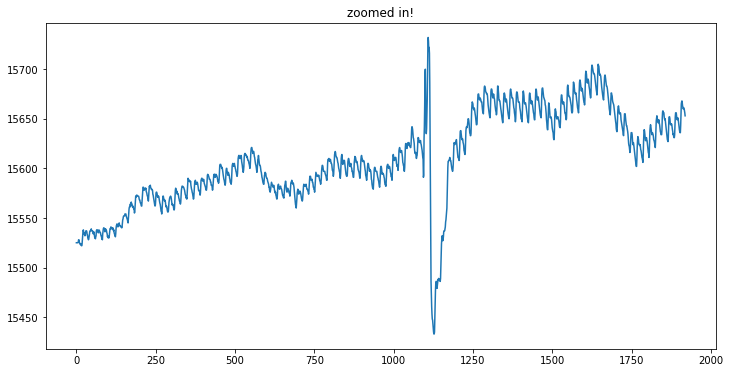
좋지는 않지만 이 코너에서 분명히 신호가 잡혔다. 분석은 비교적 간단하다. 몇 가지 표준 신호 처리 기술을 수행해야 한다.
|
# First let's filter, there's a standard butterworth
# filter implementations available in HeartPy under
# filtersignal(). We will use the bandpass variant.
# we filter out frequencies below 0.8Hz (<= 48 bpm)
# and above 3Hz (>= 180 bpm)
filtered_ppg = hp.filter_signal(data[(5 * 60) * sample_rate:
                                     (10 * 60) * sample_rate],
                                cutoff = [0.8, 2.5],
                                filtertype = 'bandpass',
                                sample_rate = sample_rate,
                                order = 3,
                                return_top = False)

# And let's plot the same segment as under 'zoomed in!' above
plt.figure(figsize=(12,6))
plt.plot(filtered_ppg[0:((2*60)*32)])
plt.show()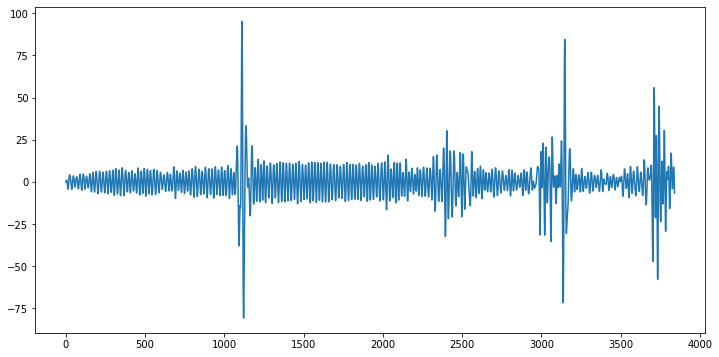
# Run the analysis. Using 'high_precision' means a spline will
# be fitted to all peaks and then the maximum determined.
# this means we can have a much higher peak position accuracy than
# the 32Hz would allow
wd, m = hp.process(filtered_ppg, sample_rate=sample_rate,
                   high_precision = True)
plt.figure(figsize=(12,6))
hp.plotter(wd, m)

for key in m.keys():
    print('%s: %f' %(key, m[key]))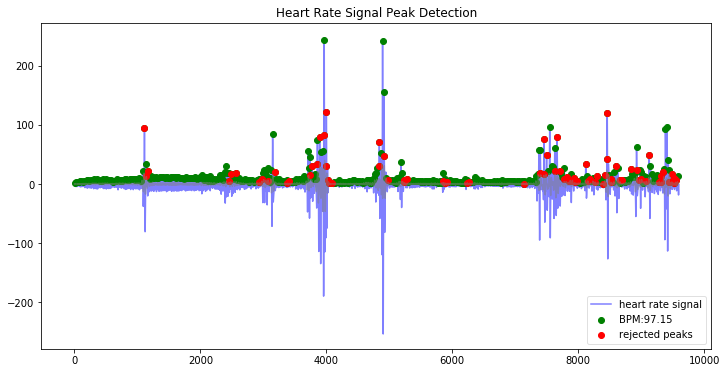
bpm: 97.147470
ibi: 617.617729
sdnn: 87.015029
sdsd: 83.851713
rmssd: 108.585723
pnn20: 0.746224
pnn50: 0.422961
hr_mad: 38.250000
sd1: 76.717543
sd2: 87.771097
s: 21154.174560
sd1/sd2: 0.874064
breathingrate: 0.450000
분 단위로 5분씩 확대한다.
plt.figure(figsize=(12,6))
plt.xlim(0, (1 * 60) * sample_rate)
hp.plotter(wd, m, title='first minute')

plt.figure(figsize=(12,6))
plt.xlim((1 * 60) * sample_rate, (2 * 60) * sample_rate)
hp.plotter(wd, m, title='second minute')

plt.figure(figsize=(12,6))
plt.xlim((2 * 60) * sample_rate, (3 * 60) * sample_rate)
hp.plotter(wd, m, title='third minute')

plt.figure(figsize=(12,6))
plt.xlim((3 * 60) * sample_rate, (4 * 60) * sample_rate)
hp.plotter(wd, m, title='fourth minute')

plt.figure(figsize=(12,6))
plt.xlim((4 * 60) * sample_rate, (5 * 60) * sample_rate)
hp.plotter(wd, m, title='fifth minute')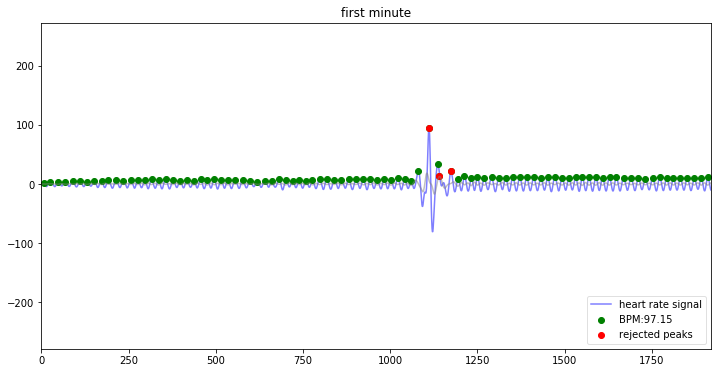
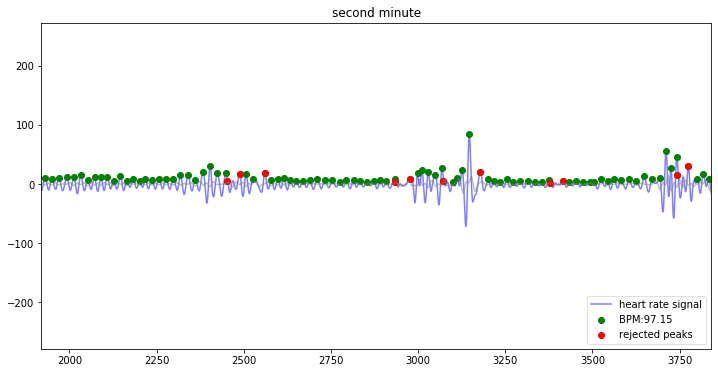
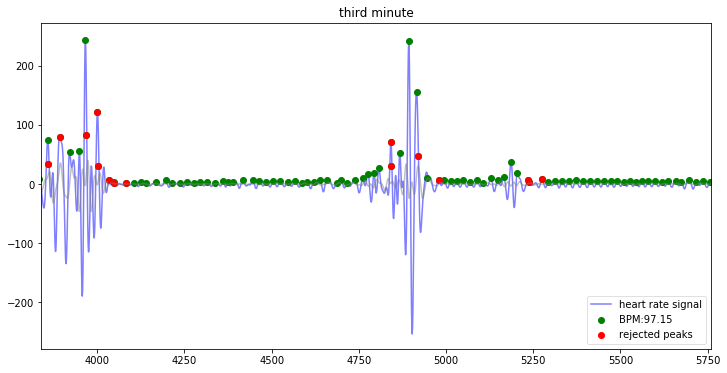
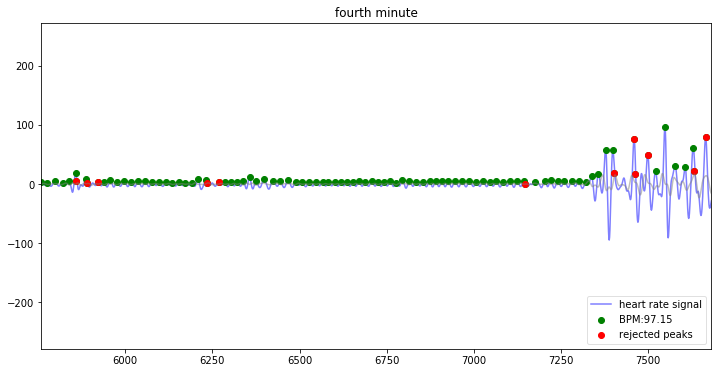
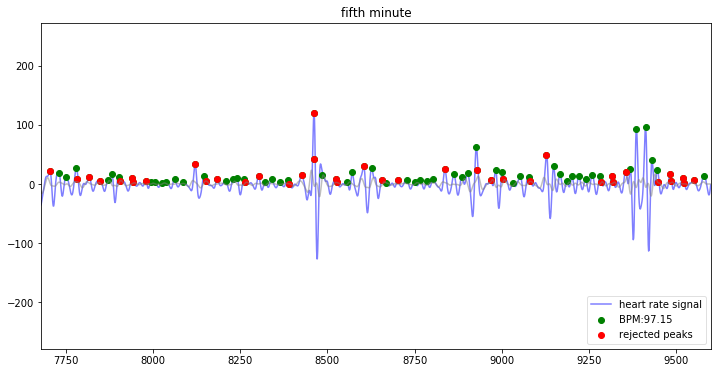
신호가 매우 희미하지만, 여전히 대부분의 피크를 추출할 수 있다.
이제 필터링 후에도 마지막 세그먼트가 노이즈가 발생하며, 스마트 링을 소스로 (낮은 진폭, 낮은 샘플링 속도) 결합하면 일부 잘못된 승인이 발생한다. 이는 특이치에 민감한 RMSSD, SDNN 및 SDSD, pNN20 및 pNN50의 높은 값을 유발한다.
HeartPy는 분석 전에 피크 피크 간격을 정리하는 옵션과 함께 제공된다. 특이치를 식별하고 거부하려고 시도한다. 이것은 신호가 길수록 더 잘 작동한다. 결국, '좋은' 피크 간격과 상대적으로 적은 '나쁜' 피크 간격이 많으면 특이치 탐지가 더 잘 작동한다.
특이치를 탐지하는 데 사용할 수 있는 방법은 '쿼터 필터', 'iqr' (사분위간 범위에 기반) 및 'z-score' (수정된 z-score 방법에 기반)이다. 기본값은 '쿼터 필터'이다.
wd, m = hp.process(filtered_ppg, sample_rate=sample_rate,
                   high_precision = True, clean_rr = True)

plt.figure(figsize=(12,6))
hp.plotter(wd, m)

for key in m.keys():
    print('%s: %f' %(key, m[key]))

#and plot poincare
hp.plot_poincare(wd, m)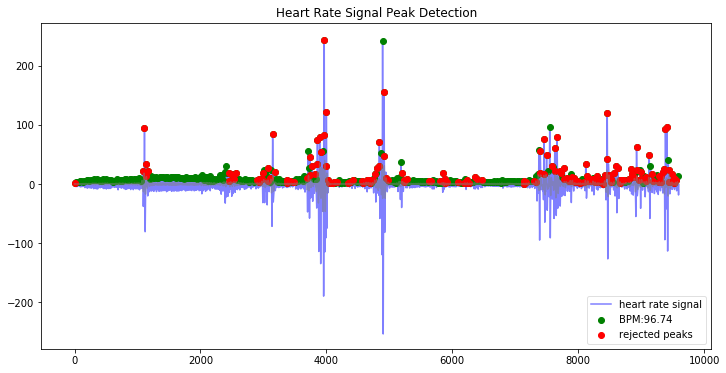
bpm: 96.741497
ibi: 620.209547
sdnn: 66.367245
sdsd: 87.034149
rmssd: 87.038704
pnn20: 0.370130
pnn50: 0.198052
hr_mad: 34.250000
sd1: 33.838365
sd2: 60.948770
s: 6479.241722
sd1/sd2: 0.555194
breathingrate: 0.390000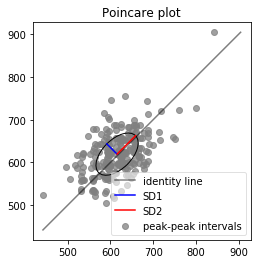
모든 HRV 측정값이 허용 가능한 범위로 떨어졌는데, 이는 몇 가지 특이치를 발견했음을 나타낸다 (마지막 1분 세그먼트).
HeartPy는 이러한 신호를 잘 처리하지만, 이를 피하는 가장 좋은 방법은 더 높은 샘플링 속도를 사용하고 좋은 신호 품질을 보장하는 것이다. 둘 다 HeartPy가 박동을 감지하는 것을 더 쉽게 해준다.
GitHub - paulvangentcom/heartrate_analysis_python: Python Heart Rate Analysis Package, for both PPG and ECG signals
Python Heart Rate Analysis Package, for both PPG and ECG signals - GitHub - paulvangentcom/heartrate_analysis_python: Python Heart Rate Analysis Package, for both PPG and ECG signals
github.com
'Python Library > HeartPy' 카테고리의 다른 글
| [HeartPy] Noisy ECG 신호 분석 (2) (0) | 2022.08.25 |
|---|---|
| [HeartPy] Noisy ECG 신호 분석 (1) (0) | 2022.08.25 |
| [HeartPy] 스마트 워치 PPG 신호 분석 (2) (0) | 2022.08.24 |
| [HeartPy] 스마트 워치 PPG 신호 분석 (1) (3) | 2022.08.24 |
| [HeartPy] ECG 신호 분석 (0) | 2022.08.24 |


