728x90
반응형
SMALL
데이터 파일 불러오기
import numpy as np
import pandas as pd
import matplotlib.pyplot as plt
import seaborn as sns

plt.rcParams["font.family"] = "Malgun Gothic"
df = pd.read_csv("test_data.csv")

df.head(10)
데이터 구조 확인
df.info()<class 'pandas.core.frame.DataFrame'>
RangeIndex: 1000 entries, 0 to 999
Data columns (total 13 columns):
# Column Non-Null Count Dtype
--- ------ -------------- -----
0 id 1000 non-null int64
1 age 1000 non-null int64
2 gender 1000 non-null int64
3 height 1000 non-null int64
4 weight 1000 non-null float64
5 ap_hi 1000 non-null int64
6 ap_lo 1000 non-null int64
7 cholesterol 1000 non-null int64
8 gluc 1000 non-null int64
9 smoke 1000 non-null int64
10 alco 1000 non-null int64
11 active 1000 non-null int64
12 cardio 1000 non-null int64
dtypes: float64(1), int64(12)
memory usage: 101.7 KBdf.describe()
컬럼 추가 및 특정 속성값 범주화
# 과체중 overweight 컬럼 추가
df['overweight'] = np.where(df['weight']/((df['height']/100)**2) > 25, 1, 0)

# 'cholesterol' 또는 'gluc'의 값이 1이면 값을 0으로 만들고, 값이 1보다 크면 값을 1로 만들기
df['cholesterol'] = np.where(df['cholesterol'] == 1, 0, 1)
df['gluc'] = np.where(df['gluc'] == 1, 0, 1)

df.head(5)
categorical plots : stripplot
graph = sns.stripplot(x="gender", y="ap_lo", data=df[:200])
categorical plots : violinplot & swarmplot
sns.violinplot(x="gender", y="ap_hi", data=df[:100])
sns.swarmplot(x="gender", y="ap_hi", data=df[:100], color='white')
categorical plots : boxenplot
sns.boxenplot(x="gender", y="ap_hi", data=df[:100])
categorical plots : catplot
sns.catplot(x="smoke", y="cholesterol", col="gender", data=df[:200], kind="bar")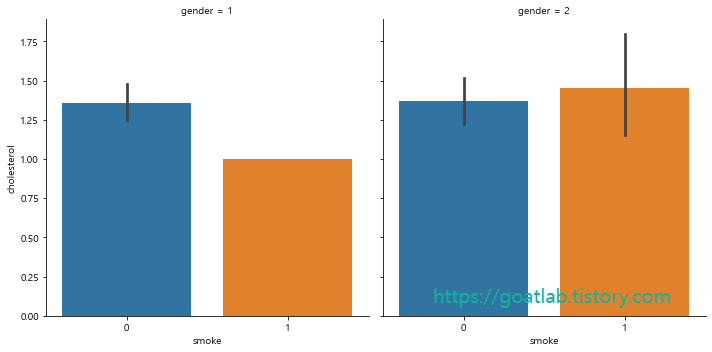
df_cat = pd.melt(df, id_vars=['cardio'], value_vars=['cholesterol', 'gluc', 'smoke', 'alco', 'active', 'overweight'])
df_cat = df_cat.groupby(['cardio','variable','value'], as_index = False).size().rename(columns = {'size':'total'})

sns.catplot(x = 'variable', hue = 'value', col = 'cardio', y = 'total', kind = 'bar', data = df_cat).set_axis_labels("variable", "total")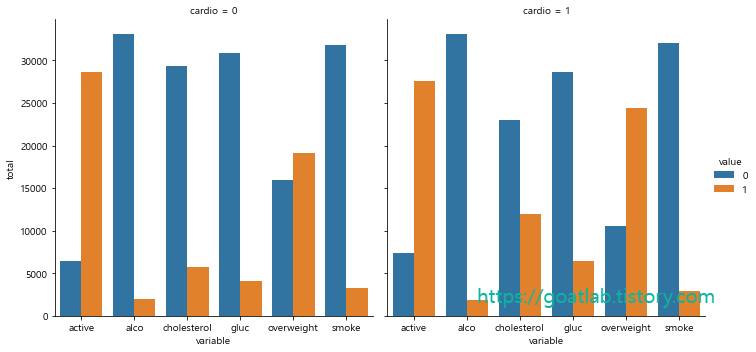
Outlier (이상치) 데이터 제외
df_heat = df[(df['ap_lo'] <= df['ap_hi']) &
             (df['height'] >= df['height'].quantile(0.025)) &
             (df['height'] <= df['height'].quantile(0.975)) &
             (df['weight'] >= df['weight'].quantile(0.025)) &
             (df['weight'] <= df['weight'].quantile(0.975))]

df_heat.describe()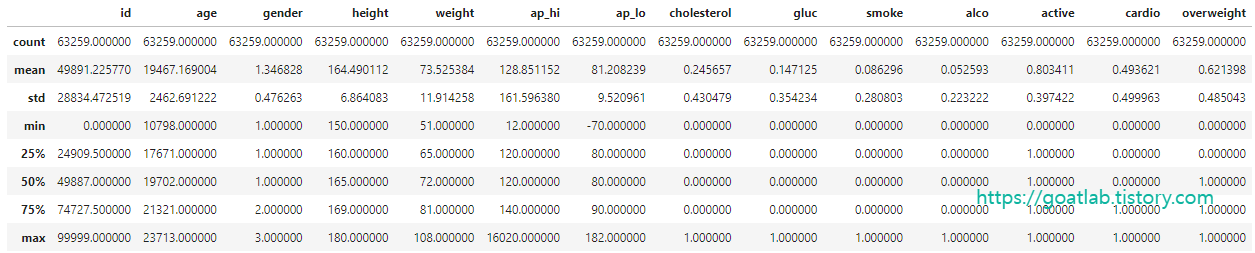
상관 관계 분석
corr = df_heat.corr()
corr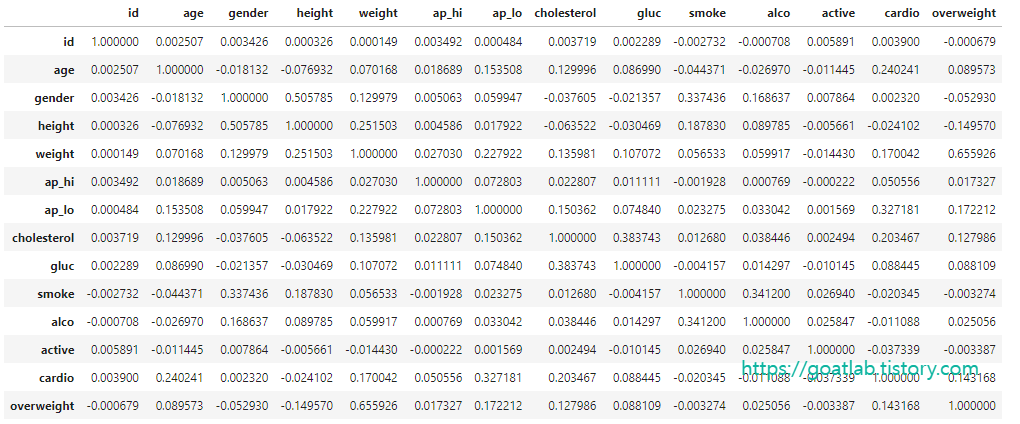
Heatmap 그리기
plt.figure(figsize=(10,10))
sns.heatmap(corr, annot=True, fmt = '.2f', linewidths=.5, cmap='Reds')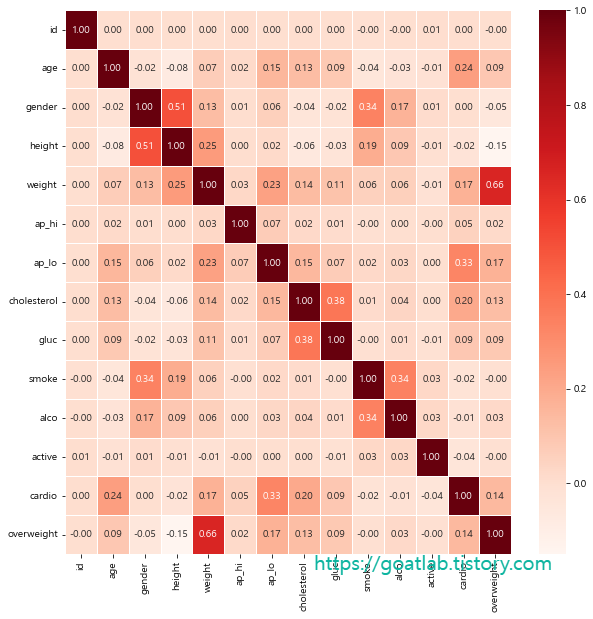
728x90
반응형
LIST
'Data-driven Methodology > DS (Data Science)' 카테고리의 다른 글
| [Data Science] 결측치 처리 (1) (0) | 2022.09.24 |
|---|---|
| [Data Science] 데이터 시각화 (4) (0) | 2022.09.22 |
| [Data Science] 데이터 시각화 (2) (0) | 2022.09.22 |
| [Data Science] 데이터 시각화 (1) (0) | 2022.09.22 |
| [Data Science] 공공포털 데이터 (9) (0) | 2022.09.22 |


