728x90
반응형
SMALL
SimpleRNN
SimpleRNN 레이어는 가장 간단한 형태의 RNN 레이어이며 기본 구조는 다음과 같다.

| Xt-1, Xt, Xt+1은 입력데이터를 나타내고 Ht-1, Ht, Ht+1은 은닉층 개념의 SimpleRNN 레이어 출력값을 Yt-1, Yt, Yt+1은 출력층의 출력값을 나타낸다. 학습 대상의 가중치는 입력층과 은닉층 사이의 가중치 Wih, 시간 t에서의 은닉층과 시간 t+1에서의 은닉층 간의 가중치 Whh, 은닉층과 출력층 사이의 가중치 Who로 구성된다. 시간 t에서 은닉층 SimpleRNN 레이어 출력은 Ht = tanh(XtWih + Ht-1Whh)이다. |
구조
시계열 데이터를 이용해서 미래 값을 예측하는 RNN 구조는 w, h 등을 설정하여 일정한 길이로 패턴을 잘라서 학습 데이터를 만들어야 한다.
| 윈도우 크기 (window size) | 이전 데이터를 몇 개를 묶을 것인지 나타냄 |
| 수평선 계수 (horizon factor) | 얼마나 먼 미래값을 예측할 것인지 지정함 |
tf.keras.layers.SimpleRNN(units=10, activation='tanh', input_shape=(3,1))| units | 일반 신경망의 은닉층 노드 수와 같다. |
| activation | 'relu'와 같은 다른 활성화 함수를 사용할 수 있다. |
| input_shape | 3개의 time-step 데이터를 이용하여 정답을 만든다는 의미이며 window size=3과 같다. 1은 RNN 레이어로 한 번에 1개의 데이터가 입력된다는 의미이다. |
| batch size : time steps (=window size)으로 분리되어 있는 데이터의 총 개수 time steps : 몇 개의 데이터를 이용해서 정답을 만들어 내는지를 나타내며 window size의 크기와 동일하다. input dims : RNN 레이어로 한 번에 들어가는 데이터의 개수 |
example
import tensorflow as tf
import numpy as np
import matplotlib.pyplot as plt
from tensorflow.keras.layers import SimpleRNN, LSTM, Dense
from tensorflow.keras import Sequential

# data 생성
x = np.arange(0, 100, 0.1)
y = np.sin(2*x) + np.cos(x) # y = sin(2x) + cos(x)

seq_data = y.reshape(-1,1)

print(seq_data.shape)
print(seq_data[:5])
(1000, 1)
[[1. ]
[1.1936735 ]
[1.36948492]
[1.51997896]
[1.63841708]]plt.grid()
plt.title('sin(2x)+cos(x)')
plt.xlabel('time')
plt.ylabel('amplitude')
plt.plot(seq_data)
plt.show()
def seq2dataset(seq, window, horizon):
    X = []
    Y = []

    for i in range(len(seq)-(window+horizon)+1):
        x = seq[i:(i+window)]
        y = (seq[i+window+horizon-1])

        X.append(x)
        Y.append(y)

    return np.array(X), np.array(Y)
w = 20 # window size
h = 1 # horizon factor
X, Y = seq2dataset(seq_data, w, h)
print(X.shape, Y.shape)(980, 20, 1) (980, 1)split_ratio = 0.8
split = int(split_ratio*len(X))
x_train = X[0:split]
y_train = Y[0:split]
x_test = X[split:]
y_test = Y[split:]
print(x_train.shape, y_train.shape, x_test.shape, y_test.shape)(784, 20, 1) (784, 1) (196, 20, 1) (196, 1)model = Sequential()
model.add(SimpleRNN(units=128, activation='tanh',input_shape=(20,1)))
model.add(Dense(1))
model.summary()Model: "sequential"
_________________________________________________________________
Layer (type) Output Shape Param #
=================================================================
simple_rnn (SimpleRNN) (None, 128) 16640
dense (Dense) (None, 1) 129
=================================================================
Total params: 16,769
Trainable params: 16,769
Non-trainable params: 0
_________________________________________________________________model.compile(loss='mse', optimizer='adam', metrics=['mae'])
from datetime import datetime
start_time = datetime.now()
hist = model.fit(x_train, y_train, epochs=100, validation_data=(x_test, y_test))
end_time = datetime.now()
print('Elapsed Time => ', end_time-start_time)plt.title('Loss Trend')
plt.plot(hist.history['loss'], label='loss')
plt.plot(hist.history['val_loss'], label='val_loss')
plt.xlabel('epoch')
plt.ylabel('loss')
plt.grid()
plt.legend(loc='best')
plt.show()
pred = model.predict(x_test)

print(pred.shape)
7/7 [==============================] - 0s 6ms/step
(196, 1)rand_idx = np.random.randint(0, len(y_test), size=5)
print('random idx = ',rand_idx, '\n')
print('pred = ', pred.flatten()[rand_idx])
print('label = ', y_test.flatten()[rand_idx])random idx = [ 19 195 152 100 88]
pred = [ 1.7307359 -0.11824127 0.63369817 -1.6904297 0.94878304]
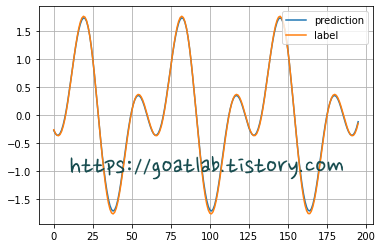
label = [ 1.7595613 -0.14522009 0.64020055 -1.74831922 0.95073622]plt.plot(pred, label='prediction')
plt.plot(y_test, label='label')
plt.grid()
plt.legend(loc='best')
plt.show()
728x90
반응형
LIST
'AI-driven Methodology > ANN' 카테고리의 다른 글
| [ANN] LSTM으로 삼성전자 주가 예측 (0) | 2022.10.21 |
|---|---|
| [ANN] SimpleRNN (2) (0) | 2022.10.21 |
| [ANN] LSTM (Long-Short Term Memory) (0) | 2022.10.11 |
| [ANN] 심층 신경망 (Deep Neural Network) (0) | 2022.10.11 |
| [ANN] 다층 퍼셉트론 (Multi-Layer Perceptron) (2) (0) | 2022.10.11 |


