컨투어 추정
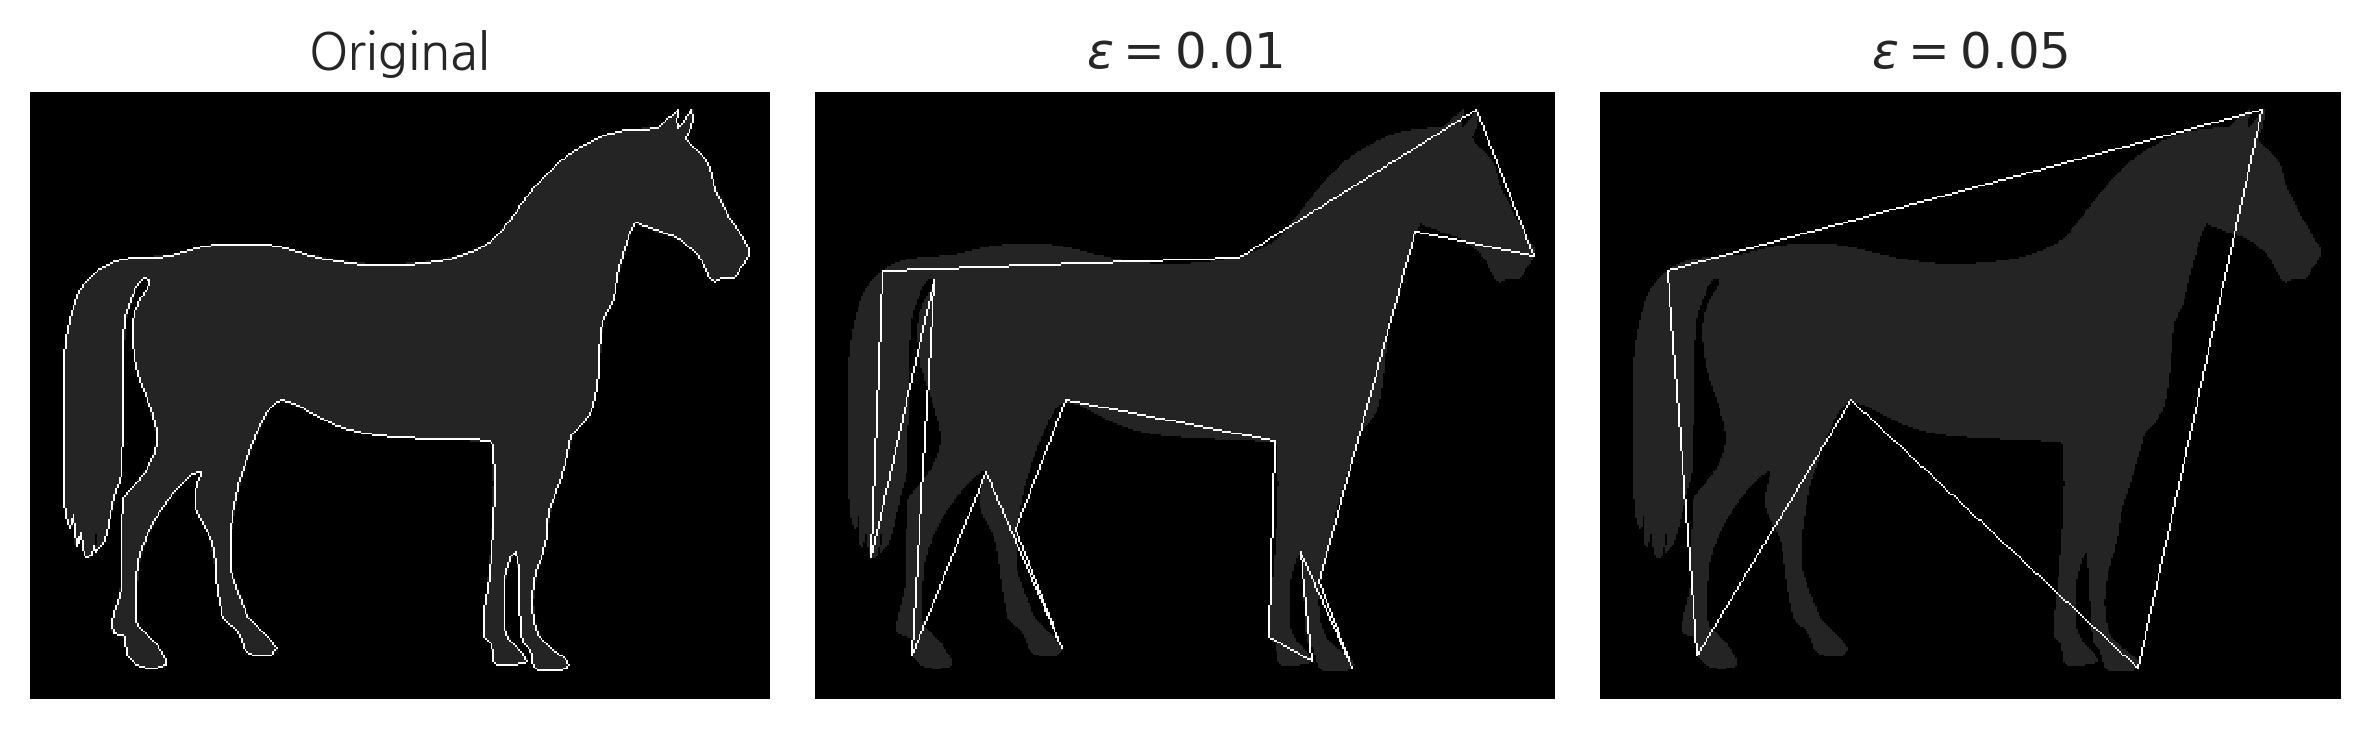
컨투어 추정은 Douglas-Peucker 알고리즘을 이용해 컨투어 포인트의 수를 줄여 실제 컨투어 라인과 근사한 라인을 그릴 때 사용된다.
OpenCV에서는 approxPolyDP 라는 함수로 구현되어 있다. 입력값으로는 컨투어 포인트 배열, 실제 컨투어 라인과 근사치의 최대거리, 폐곡선 여부가 있다. 다음 코드는 실제 컨투어 라인과 근사치의 최대거리를 0.01, 0.05 로 설정하여 실제 컨투어 라인과 비교 한다.
img1 = img_raw.copy().astype('uint8')
img2 = img_raw.copy().astype('uint8')
img3 = img_raw.copy().astype('uint8')

c0 = contours[0]

epsilon1 = 0.01*cv2.arcLength(c0, True)
epsilon2 = 0.05*cv2.arcLength(c0, True)

approx1 = cv2.approxPolyDP(c0, epsilon1, True)
approx2 = cv2.approxPolyDP(c0, epsilon2, True)

image1 = cv2.drawContours(img1, [c0], -1, 7)  #
image2 = cv2.drawContours(img2, [approx1], -1, 7)
image3 = cv2.drawContours(img3, [approx2], -1, 7)

titles = ['Original', '$\epsilon=0.01$', '$\epsilon=0.05$']
images = [image1, image2, image3]

for i in range(3):
    plt.subplot(1, 3, i+1)
    plt.title(titles[i])
    plt.imshow(images[i], cmap='gray')
    plt.axis('off')

plt.tight_layout()
plt.show()
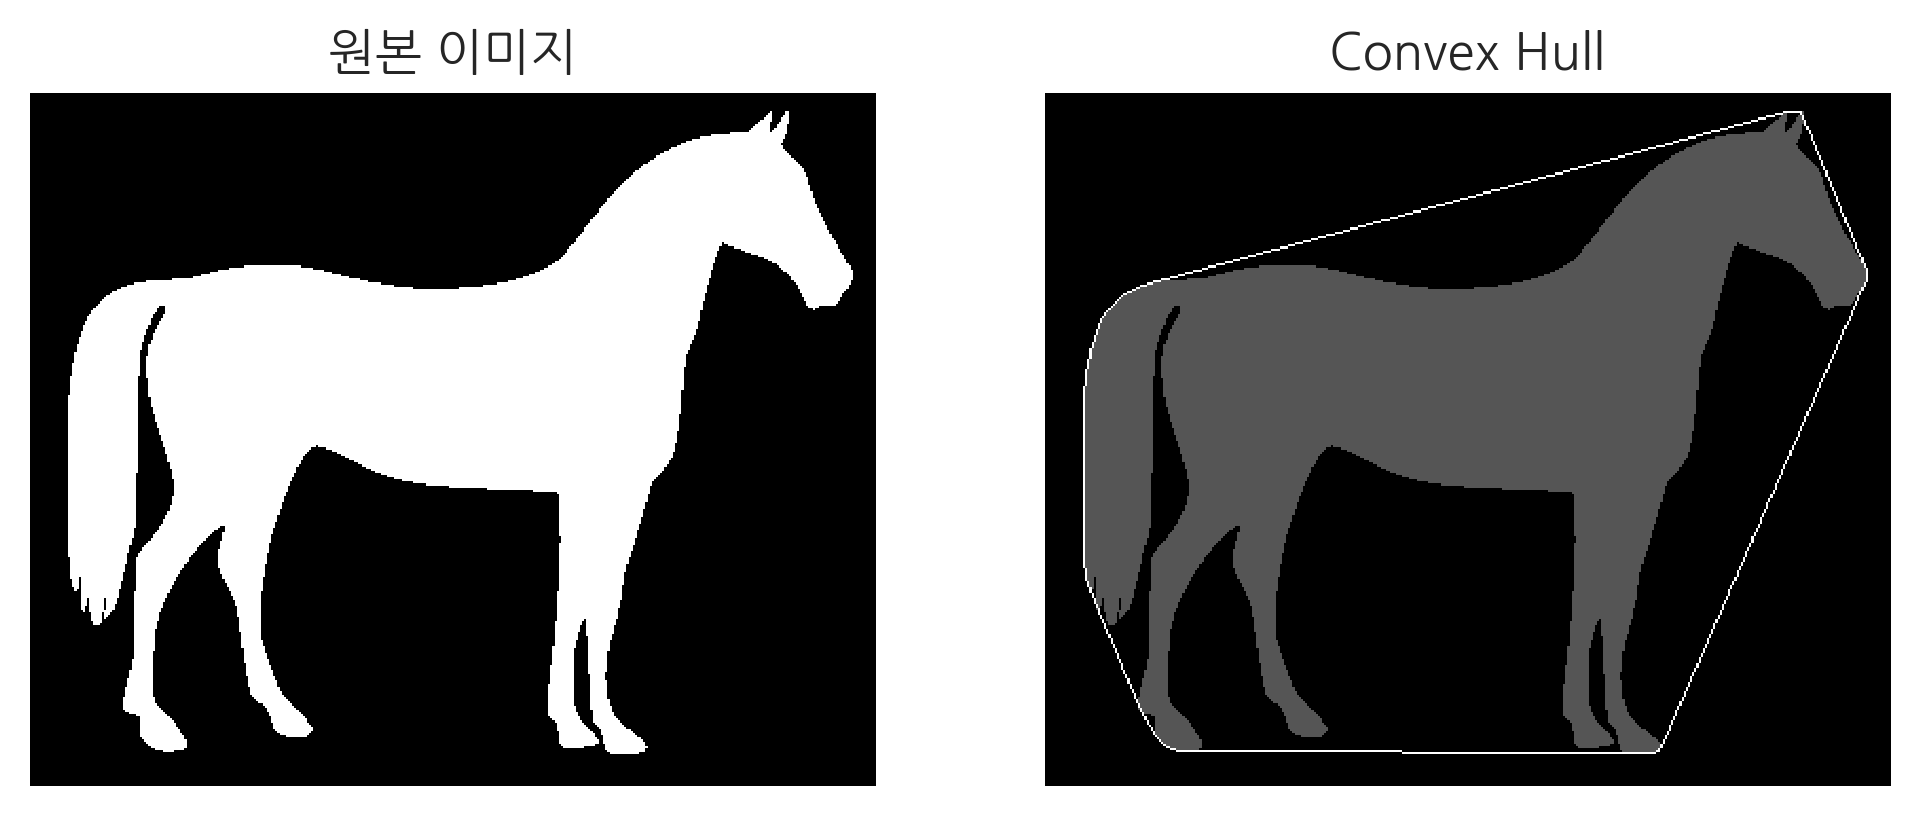
Convex Hull
Convex Hull이란 컨투어 포인트를 모두 포함하는 볼록한 외곽선을 의미한다. 결과는 컨투어 추정과 비슷하지만 방법이 다르다. 먼저, cv2.isContourConvex() 함수를 사용해 이미지의 컨투어가 볼록 (convex)한지 확인할 수 있다. 입력한 컨투어 배열이 볼록 (convex)하다면 True, 아니라면 False 값을 반환한다. 이때, 볼록하다는 것은 컨투어 라인이 볼록하거나 평평한 선이라는 의미이다. 이전에 확인 했듯이 말 이미지의 컨투어 라인은 볼록한 선으로만 이루어져있지 않다. 따라서, 다음 코드의 결과는 False를 반환한다.
cv2.isContourConvex(c0)
False
컨투어 라인이 볼록하지 않다면, cv2.convexHull() 함수를 사용해 컨투어라인을 볼록하게 만들 수 있다.
img4 = img_raw.copy().astype('uint8')

c0 = contours[0]
hull = cv2.convexHull(c0)
image4 = cv2.drawContours(img4, [hull], 0, 3)
titles = ['원본 이미지', 'Convex Hull']
images = [img_raw, img4]

for i in range(2):
    plt.subplot(1, 2, i+1)
    plt.title(titles[i])
    plt.imshow(images[i], 'gray')
    plt.axis('off')

plt.show()
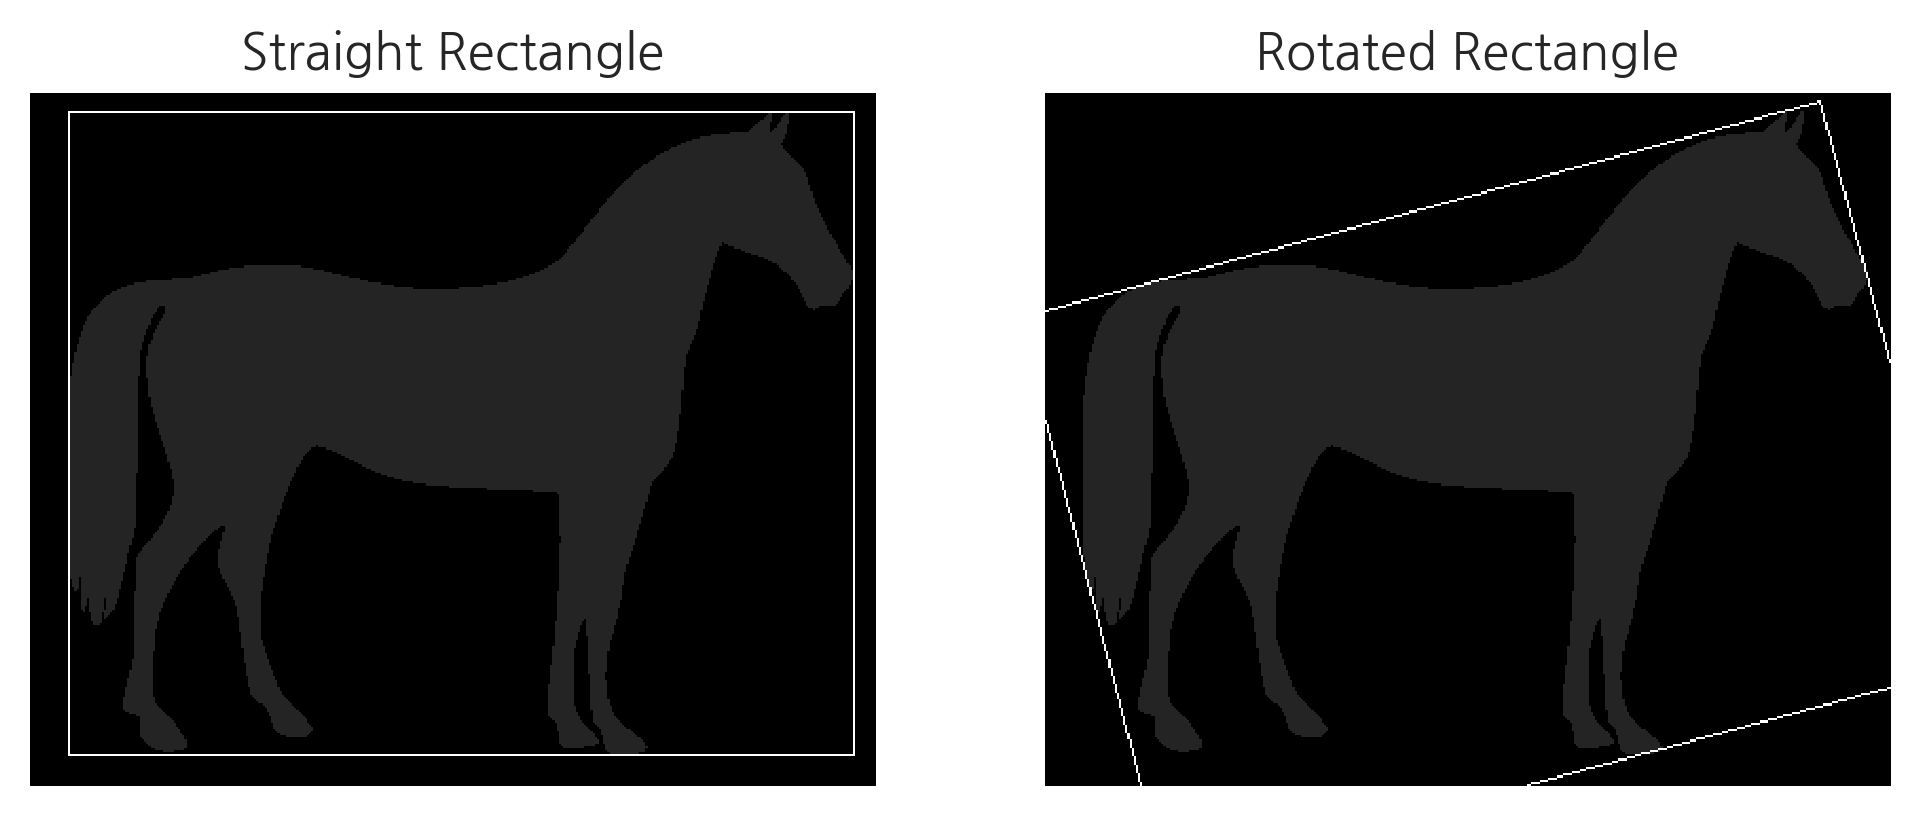
Bounding Rectangle
Bounding Rectangle은 컨투어 라인을 둘러싸는 사각형을 그리는 방법이다. 사각형을 그리는 방법은 2가지가 있다.
|
다음 코드는 컨투어 라인 위에 두 가지 종류의 사각형을 그린다.
img1 = img_raw.copy().astype("uint8")
img2 = img_raw.copy().astype("uint8")

# Straight Rectangle
x, y, w, h = cv2.boundingRect(c0)
img1 = cv2.rectangle(img1, (x, y), (x+w, y+h), 7)

# Rotated Rectangle
rect = cv2.minAreaRect(c0)
box = cv2.boxPoints(rect)
box = box.astype('int')
img2 = cv2.drawContours(img2, [box], -1, 7) # blue

plt.subplot(1,2,1)
plt.imshow(img1, cmap="gray")
plt.axis('off')
plt.title("Straight Rectangle")
plt.subplot(1,2,2)
plt.imshow(img2, cmap="gray")
plt.axis('off')
plt.title("Rotated Rectangle")
plt.show()
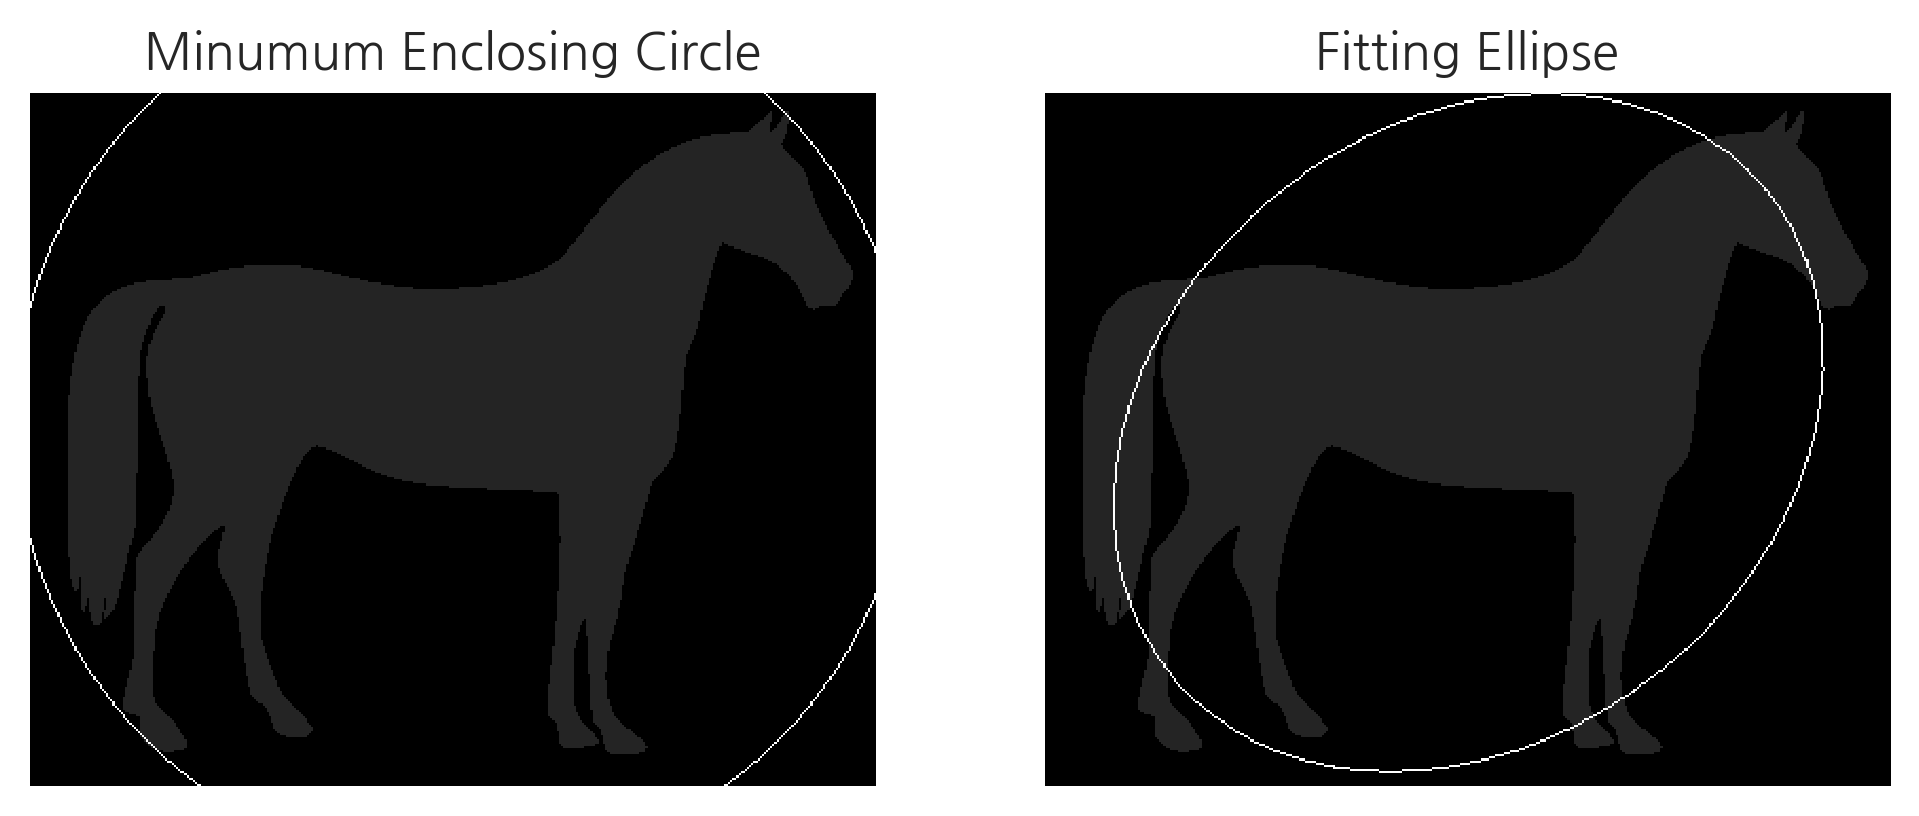
Minumum Enclosing Circle / Fitting Ellipse
Minumum Enclosing Circle과 Fitting Ellipse는 각각 컨투어 라인을 완전히 포함하는 가장 작은 원과 타원을 그리는 것이다.
img3 = img_raw.copy().astype("uint8")
img4 = img_raw.copy().astype("uint8")

(x, y), radius = cv2.minEnclosingCircle(c0)
center = int(x), int(y)
radius = int(radius)
img3 = cv2.circle(img3, center, radius, 7)

ellipse = cv2.fitEllipse(c0)
img4 = cv2.ellipse(img4, ellipse, 7)


plt.subplot(1,2,1)
plt.imshow(img3, cmap="gray")
plt.axis('off')
plt.title("Minumum Enclosing Circle")
plt.subplot(1,2,2)
plt.imshow(img4, cmap="gray")
plt.axis('off')
plt.title("Fitting Ellipse")
plt.show()
이미지 컨투어 — 데이터 사이언스 스쿨
.ipynb .pdf to have style consistency -->
datascienceschool.net
'AI-driven Methodology > CV (Computer Vision)' 카테고리의 다른 글
| [Computer Vision] 임계 처리 (0) | 2022.06.13 |
|---|---|
| [Computer Vision] 이미지 변환 (0) | 2022.06.13 |
| [Computer Vision] 이미지 컨투어 (0) | 2022.06.13 |
| [Computer Vision] Scikit-Image (0) | 2022.06.13 |
| [Computer Vision] Pillow를 이용한 이미지 처리 (0) | 2022.06.13 |


