The Mel Scale
Mel Scale은 수학적으로 말하면 주파수 스케일의 비선형 변환 결과이다. 인간은 주파수를 linear scale (선형 척도)로 인식하지 못한다. 인간은 높은 주파수보다 낮은 주파수에서의 차이를 더 잘 감지한다. 예를 들어, 00Hz와 1000Hz 사이의 차이는 분명한 반면, 7500Hz와 8000Hz 사이의 차이는 거의 눈에 띄지 않는다. 연구에서 사람이 동일한 거리에서 소리가 들리도록 하는 pitch 단위를 제안했다. 이것을 Mel Scale이라고 한다. 이 Mel Scale은 Mel Scale에서 서로 같은 거리에 있는 소리가 서로 거리가 같으므로 인간에게도 "소리"가 나도록 구성되었다. 주파수에 대한 수학적 연산을 수행하여 주파수를 Mel Scale로 변환한다.
비선형 변환의 예제는 다음과 같다.
import librosa
import librosa.display

plt.figure(figsize=(15, 4));

plt.subplot(1, 3, 1);
librosa.display.specshow(mel, sr=sr, hop_length=hop_length, x_axis='linear');
plt.ylabel('Mel filter');
plt.colorbar();
plt.title('1. Our filter bank for converting from Hz to mels.');

plt.subplot(1, 3, 2);
mel_10 = librosa.filters.mel(sr=sr, n_fft=n_fft, n_mels=10)
librosa.display.specshow(mel_10, sr=sr, hop_length=hop_length, x_axis='linear');
plt.ylabel('Mel filter');
plt.colorbar();
plt.title('2. Easier to see what is happening with only 10 mels.');

plt.subplot(1, 3, 3);
idxs_to_plot = [0, 9, 49, 99, 127]
for i in idxs_to_plot:
    plt.plot(mel[i]);
plt.legend(labels=[f'{i+1}' for i in idxs_to_plot]);
plt.title('3. Plotting some triangular filters separately.');

plt.tight_layout();
이제, 변환을 수행하기 위해 mel과 내적을 계산하고, 이 새로운 주파수 스케일에서 사운드의 시각화를 얻을 수 있다.
plt.plot(D[:, 1]);
plt.plot(mel.dot(D[:, 1]));
plt.legend(labels=['Hz', 'mel']);
plt.title('One sampled window for example, before and after converting to mel.');
The Mel Spectrogram
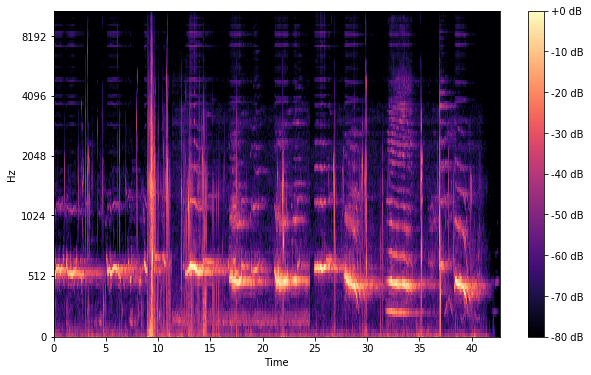
Mel Spectrogram이란 Spectrogram을 Mel Scale로 재조정한 것이다. 신호를 일정 간격마다의 주파수 분석을 통해서 주파수의 크기를 기준으로 시각화한 것이 Spectrogram인데, 사람의 귀는 주파수 대역에 따라 민감도가 달라 (낮은 주파수 일 수록 그 차이에 더 민감)서 이러한 주파수 단위의 Spectrogram을 사람이 더 잘 받아들일 수 있게 Mel Scale 단위로 재조정한 것이 바로 Mel Spectrogram이다. Mel Spectrogram은 음성 신호의 feature로 주로 사용된다.
S = librosa.feature.melspectrogram(whale_song, sr=sr, n_fft=n_fft, hop_length=hop_length, n_mels=n_mels)
S_DB = librosa.power_to_db(S, ref=np.max)
librosa.display.specshow(S_DB, sr=sr, hop_length=hop_length, x_axis='time', y_axis='mel');
plt.colorbar(format='%+2.0f dB');
https://towardsdatascience.com/getting-to-know-the-mel-spectrogram-31bca3e2d9d0
Getting to Know the Mel Spectrogram
Read this short post if you want to be like Neo and know all about the Mel Spectrogram!
towardsdatascience.com
'Signal Processing' 카테고리의 다른 글
| 코덱 (Codec) (0) | 2023.10.25 |
|---|---|
| Welch's Method (0) | 2023.08.23 |
| [Signal Processing] 이동 평균 필터 (Moving average filter) (0) | 2023.07.06 |
| Wavelet 변환 (0) | 2022.04.19 |
| Use of AR Models to Estimate Spectra (0) | 2022.04.13 |


