728x90
반응형
SMALL
시각화
import numpy as np
import pandas as pd
import matplotlib.pyplot as plt

se0 = pd.Series(np.random.randn(100).cumsum())
se0.plot()
df = pd.DataFrame(np.random.randn(100, 5).cumsum(0),
                  columns= ['arr1', 'arr2', 'arr3', 'arr4', 'arr5'] )
df.plot()
막대 그래프
se0.plot(kind='bar')
df.plot(kind='bar')
# 가로 바 차트
se0.plot(kind='barh')
df.plot(kind='barh')
df.plot(kind='bar', stacked=True)
히스토그램
값의 빈도를 분리해서 출력한다.
se0.hist(bins=50)
df.hist(bins=50)
커널 밀도 추정 그래프
se0.plot(kind='kde')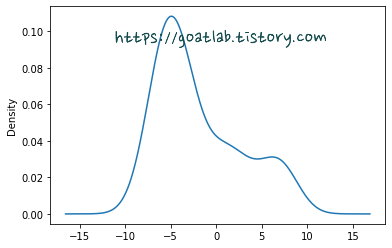
df.plot(kind='kde')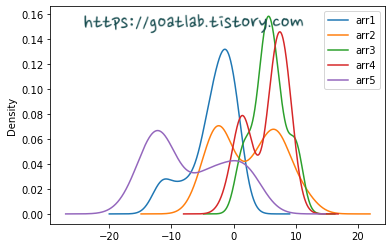
그래프 중첩
se0.hist(bins=100,  density=True)
se0.plot(kind='kde')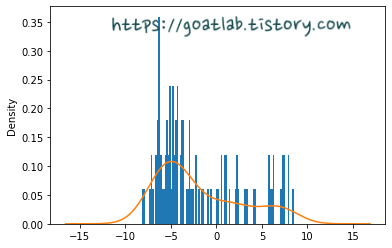
728x90
반응형
LIST
'Python Library > Pandas' 카테고리의 다른 글
| [Pandas] 타이타닉 생존자 분석 (0) | 2022.10.25 |
|---|---|
| [Pandas] Iris (붓꽃) (0) | 2022.10.25 |
| [Pandas] HTML 파일에서 데이터 입출력 (0) | 2022.10.21 |
| [Pandas] 폴더 안에 있는 여러 개의 csv 파일 합치기 (0) | 2022.10.20 |
| [Pandas] shuffle (0) | 2022.10.17 |


