728x90
반응형
SMALL
Bokeh를 활용한 대화형 웹 시각화
# bokeh 설치
conda install bokeh
import numpy as np
from bokeh.io import output_notebook, show
from bokeh.plotting import figure
output_notebook()
p = figure(plot_width=400, plot_height=400)
x = [1,2,3,4,5]
y = [6,7,2,4,5]
p.circle(x, y, size=15, line_color='navy', fill_color='orange', fill_alpha=0.5)
show(p)
HTML 파일로 추출
import bokeh

# 샘플 데이터 다운로드
bokeh.sampledata.download()
import pandas as pd
from bokeh.plotting import figure
from bokeh.sampledata.stocks import AAPL # 주식 관련 데이터
aapl_df = pd.DataFrame(AAPL)
# 일반 문자열 등을 시간 관련 데이터 형(판다스)으로 바꿈
aapl_df['date'] = pd.to_datetime(aapl_df['date'])
aapl_df
import jinja2
from bokeh.embed import components

template = jinja2.Template("""
<!DOCTYPE html>
<html lang="en-US">
<link href="http://cdn.pydata.org/bokeh/release/bokeh-2.4.2.min.css"
    rel="stylesheet" type="text/css" >
<script src="http://cdn.pydata.org/bokeh/release/bokeh-2.4.2.min.js">
</script>
<body>
    <h1>Hello Bokeh!</h1>
    <p> Below is a simple plot of stock closing prices </p>
    {{ script }}
    {{ div }}
</body>
</html>""")
p = figure(plot_width=800, plot_height=250, x_axis_type="datetime")
p.line(aapl_df['date'], aapl_df['close'], color='navy', alpha=0.5)
script, div = components(p)from IPython.display import HTML
HTML(template.render(script=script, div=div))
show(p)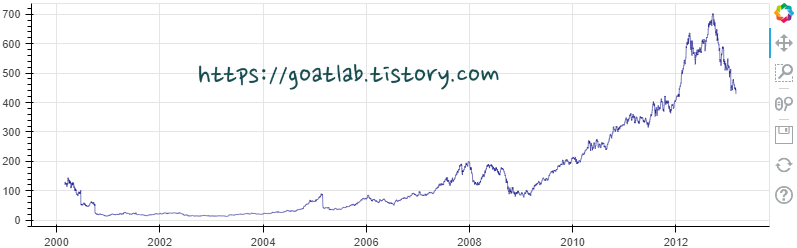
# 구성한 그래프와 html 파일을 결합해서 파일로 작성
with open('bokeh_test.html', 'w') as f:
    f.write(template.render(script=script, div=div))

# with를 벗어나면 자동으로 close
728x90
반응형
LIST
'Data-driven Methodology > DS (Data Science)' 카테고리의 다른 글
| [Data Science] 데이터 전처리 (0) | 2022.11.01 |
|---|---|
| [Data Science] folium을 활용한 지도 그리기 (0) | 2022.10.26 |
| [Data Science] 시계열 데이터 (Time Series Data) (0) | 2022.10.11 |
| [Data Science] 문서의 행렬 표현 (DTM and TF-IDF) (0) | 2022.09.29 |
| [Data Science] Text Preprocessing (0) | 2022.09.29 |


