728x90
반응형
SMALL
Benefits of Early Stopping
손실은 신경망이 오답에 대해 어느 정도 확신을 가졌는지를 측정한다. 정확도는 신경망의 신뢰도와 관계없이 올바른 분류의 비율이다.
import matplotlib.pyplot as plt

history_dict = history.history
acc = history_dict['accuracy']
val_acc = history_dict['val_accuracy']
loss = history_dict['loss']
val_loss = history_dict['val_loss']
epochs = range(1, len(acc) + 1)

plt.plot(epochs, loss, 'bo', label='Training loss')
plt.plot(epochs, val_loss, 'b', label='Validation loss')
plt.title('Training and validation loss')
plt.xlabel('Epochs')
plt.ylabel('Loss')
plt.legend()
plt.show()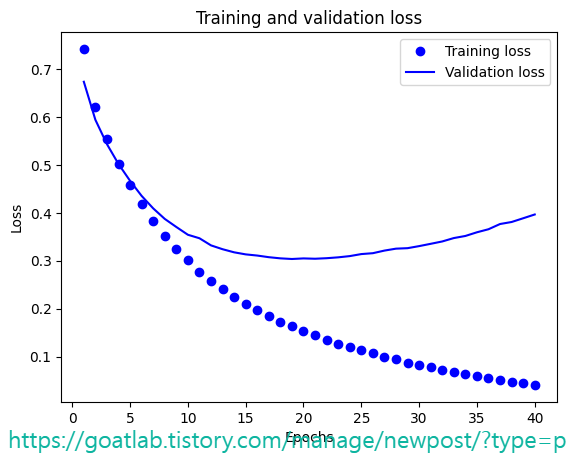
피팅 초기에는 훈련과 검증 손실이 비슷하다는 것을 알 수 있다. 그러나 피팅이 계속되고 과적합이 시작되면 훈련 손실과 검증 손실이 서로 달라진다. 훈련 손실은 지속적으로 감소한다. 그러나 일단 과적합이 발생하면 검증 손실은 더 이상 떨어지지 않고 결국 약간 증가하기 시작한다. 이 과정의 앞부분에서 살펴본 조기 중지를 통해 일부 과적합을 방지할 수 있다.
plt.clf()  # clear figure
plt.plot(epochs, acc, 'bo', label='Training accuracy')
plt.plot(epochs, val_acc, 'b', label='Validation accuracy')
plt.title('Training and validation accuracy')
plt.xlabel('Epochs')
plt.ylabel('Accuracy')
plt.legend()
plt.show()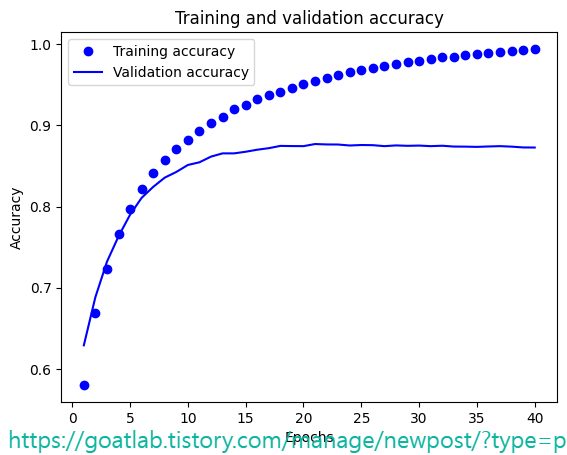
이제, 조기 중지로 피팅을 반복하면 조기 중지 모니터를 생성하고 네트워크의 가중치를 무작위로 복원한다. 이 작업이 완료되면 조기 중지 모니터를 활성화한 상태에서 신경망을 피팅할 수 있다.
from tensorflow.keras.callbacks import EarlyStopping

monitor = EarlyStopping(monitor='val_loss', min_delta=1e-3, patience=5, verbose=1, mode='auto', restore_best_weights=True)

model.set_weights(init_weights)
history = model.fit(partial_x_train, partial_y_train, epochs=40, batch_size=512, callbacks=[monitor], validation_data=(x_val, y_val), verbose=1)
Epoch 23/40
29/30 [============================>.] - ETA: 0s - loss: 0.1255 - accuracy: 0.9627Restoring model weights from the end of the best epoch: 18.
30/30 [==============================] - 2s 60ms/step - loss: 0.1254 - accuracy: 0.9627 - val_loss: 0.3105 - val_accuracy: 0.8763
Epoch 23: early stopping
훈련 이력 차트가 더 짧아진 것은 더 일찍 중단했기 때문이다.
history_dict = history.history
acc = history_dict['accuracy']
val_acc = history_dict['val_accuracy']
loss = history_dict['loss']
val_loss = history_dict['val_loss']
epochs = range(1, len(acc) + 1)
plt.plot(epochs, loss, 'bo', label='Training loss')
plt.plot(epochs, val_loss, 'b', label='Validation loss')
plt.title('Training and validation loss')
plt.xlabel('Epochs')
plt.ylabel('Loss')
plt.legend()

plt.show()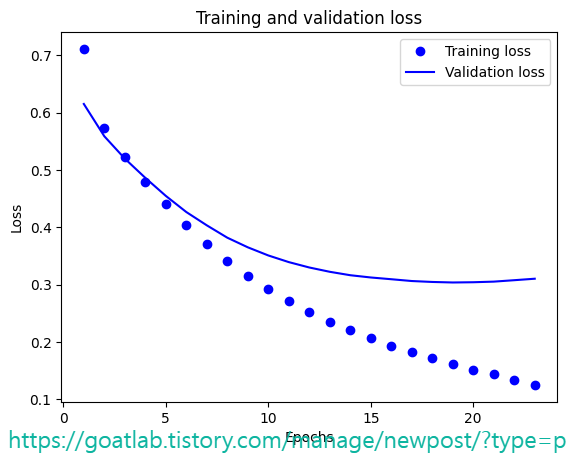
728x90
반응형
LIST
'DNN with Keras > Transfer Learning' 카테고리의 다른 글
| StyleGAN을 위한 이미지 전처리 (0) | 2024.02.14 |
|---|---|
| Transfer Learning for Facial Points and GANs (0) | 2024.02.14 |
| Transfer Learning for NLP with Keras (0) | 2024.02.13 |
| 네트워크 생성 및 가중치 전송 (0) | 2024.02.13 |
| Keras Transfer Learning for Computer Vision (0) | 2024.02.13 |


