728x90
반응형
SMALL
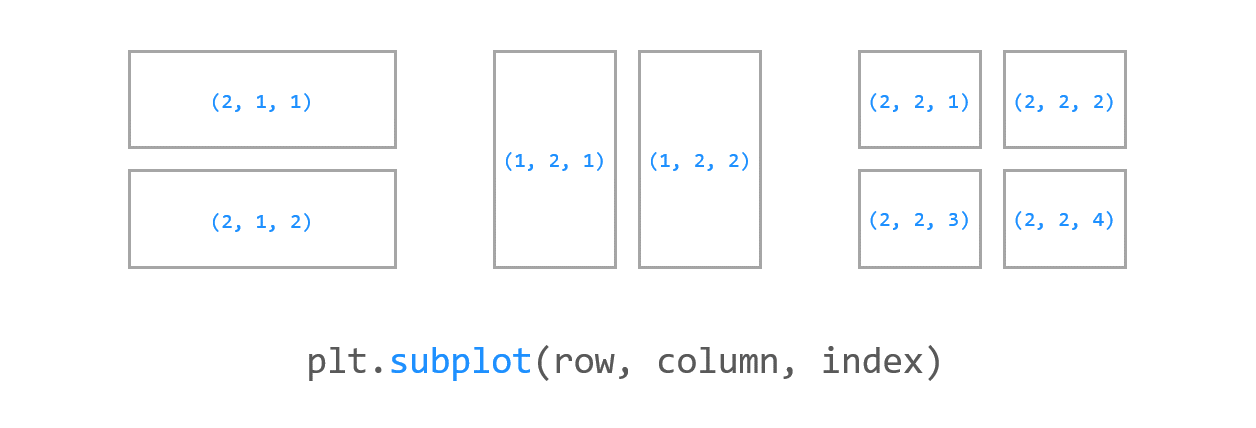
Matplotlib 여러 개의 그래프 그리기
1)
import numpy as np
import matplotlib.pyplot as plt

x1 = np.linspace(0.0, 5.0)
x2 = np.linspace(0.0, 2.0)

y1 = np.cos(2 * np.pi * x1) * np.exp(-x1)
y2 = np.cos(2 * np.pi * x2)

plt.subplot(2, 1, 1)                # nrows=2, ncols=1, index=1
plt.plot(x1, y1, 'o-')
plt.title('1st Graph')
plt.ylabel('Damped oscillation')

plt.subplot(2, 1, 2)                # nrows=2, ncols=1, index=2
plt.plot(x2, y2, '.-')
plt.title('2nd Graph')
plt.xlabel('time (s)')
plt.ylabel('Undamped')

plt.tight_layout()
plt.show()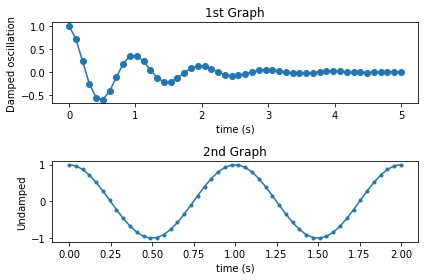
2)

import numpy as np
import matplotlib.pyplot as plt

x1 = np.linspace(0.0, 5.0)
x2 = np.linspace(0.0, 2.0)

y1 = np.cos(2 * np.pi * x1) * np.exp(-x1)
y2 = np.cos(2 * np.pi * x2)

ax1 = plt.subplot(2, 1, 1)                # nrows=2, ncols=1, index=1
plt.plot(x1, y1, 'o-')
plt.ylabel('Damped oscillation')
plt.xticks(visible=False)

ax2 = plt.subplot(2, 1, 2, sharex=ax1)    # nrows=2, ncols=1, index=2
plt.plot(x2, y2, '.-')
plt.xlabel('time (s)')
plt.ylabel('Undamped')

plt.tight_layout()
plt.show()
plt.subplot() 함수의 sharex 또는 sharey 파라미터를 사용하면 두 그래프의 축을 공유할 수 있다. sharex를 사용해서 두 그래프가 x축을 공유하도록 할 수 있다. x축의 범위와 눈금이 동일하게 표시된다.
https://codetorial.net/matplotlib/subplot.html
Matplotlib 여러 개의 그래프 그리기 - Codetorial
예제2 import numpy as np import matplotlib.pyplot as plt x1 = np.linspace(0.0, 5.0) x2 = np.linspace(0.0, 2.0) y1 = np.cos(2 * np.pi * x1) * np.exp(-x1) y2 = np.cos(2 * np.pi * x2) plt.subplot(1, 2, 1) # nrows=1, ncols=2, index=1 plt.plot(x1, y1, 'o-') p
codetorial.net
728x90
반응형
LIST
'Python Library > Matplotlib' 카테고리의 다른 글
| [Matplotlib] 다중 축을 사용한 그래프 생성 (0) | 2023.05.25 |
|---|---|
| [Matplotlib] 공백 지우기 (0) | 2023.04.27 |
| [Matplotlib] Pandas의 시각화 기능 (0) | 2022.02.22 |
| [Matplotlib] Seaborn을 사용한 데이터 분포 시각화 (3) (0) | 2022.02.22 |
| [Matplotlib] Seaborn을 사용한 데이터 분포 시각화 (2) (0) | 2022.02.22 |


