728x90
반응형
SMALL
Multiple Plots
동일한 graph에 여러 개의 그림을 추가하려면 동일한 (graph=) parameter를 사용하여 새 그림을 만든다.
plot2 = <type>(graph=g,color=color.green,data=[[10,11],[12,13],… ])
여기서 plot type이 동일할 필요는 없다.
Legend
범례 (legend)를 추가하려면 새 그림을 만들 때 (label=) parameter를 사용한다.
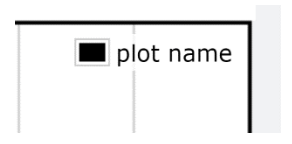
plot2 = <type>(graph=g,data=[[1,2],[3,4],… ],label=”plot name”) Aside on for loops: for i in range(start,stop): for i in range(start, stop, step size): for i in range(0,10): for i in range(0,10,2): - Default is step size of 1 - Specify the step size
gcurve – Line Plot
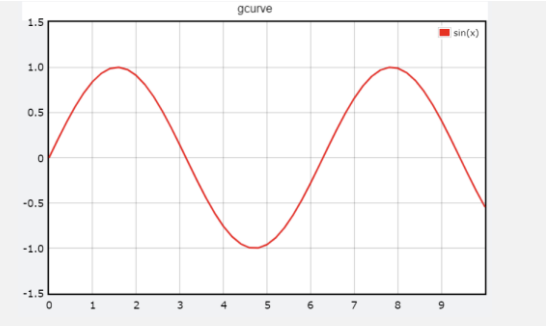
g = graph(title='gcruve graph') plot1 = gcurve(graph=g, color=color.red, label="sin(x)") # range is list of numbers from 0 to 10 with step of 0.2 for x in range(0,10,0.2): plot1.plot(x, sin(x))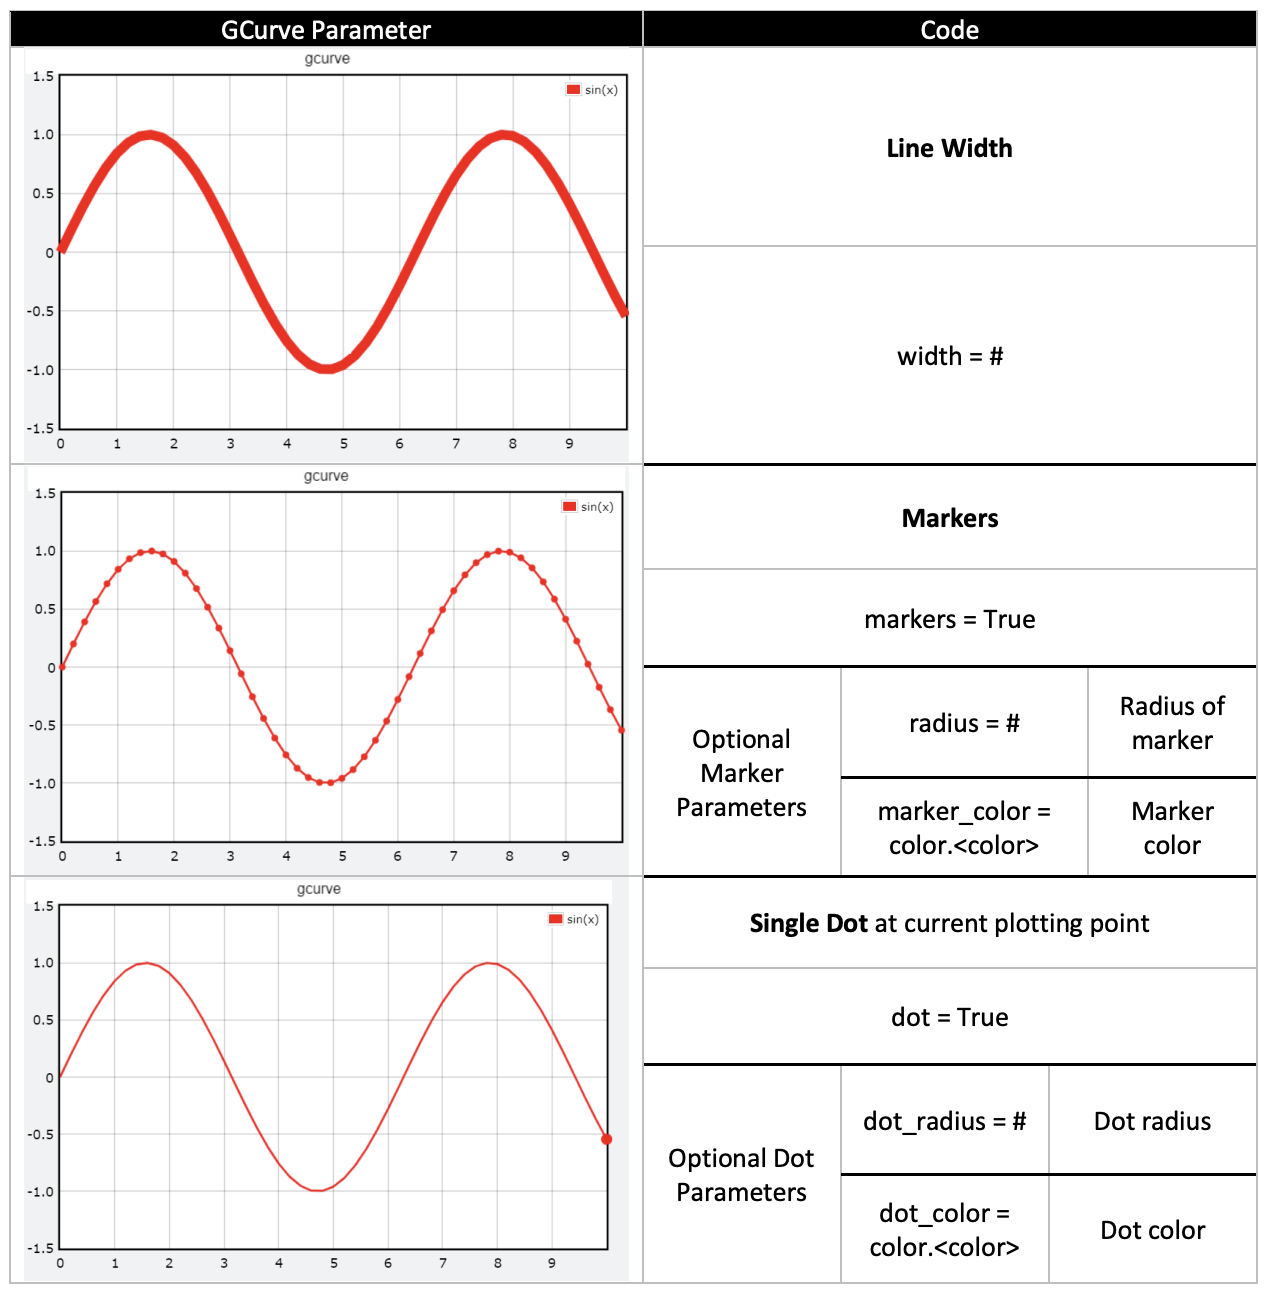
gdots – Scatter Plot
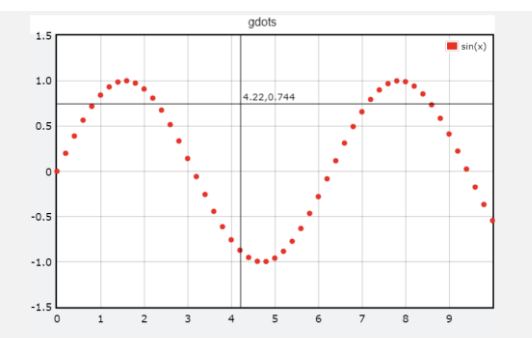
g = graph(title='gdots') plot1 = gdots(graph=g, color=color.red, label="sin(x)") for x in range(0,10,0.2): plot1.plot(x, sin(x))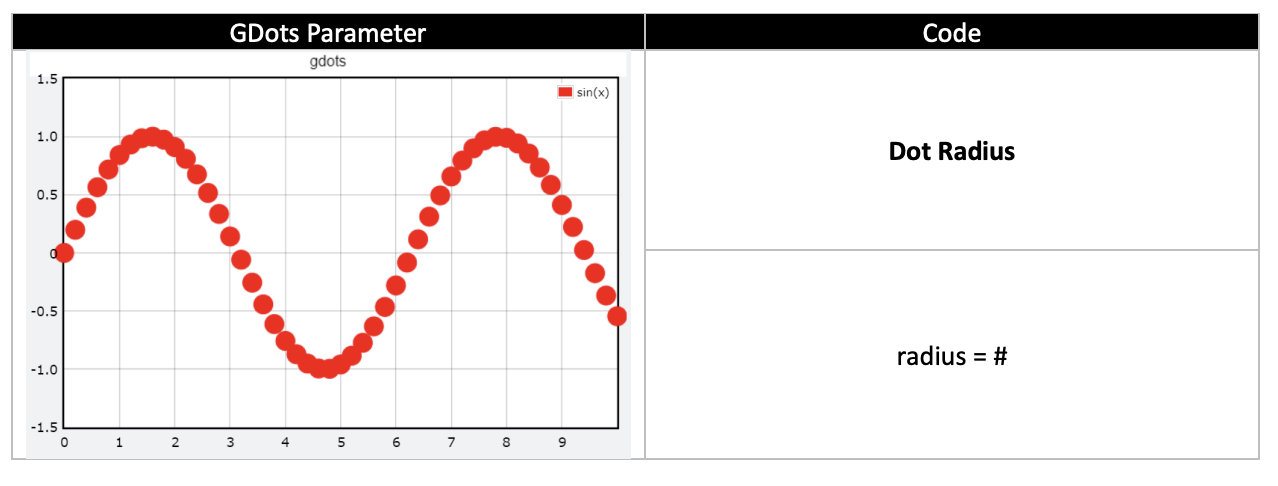
gvbars – Vertical Bars
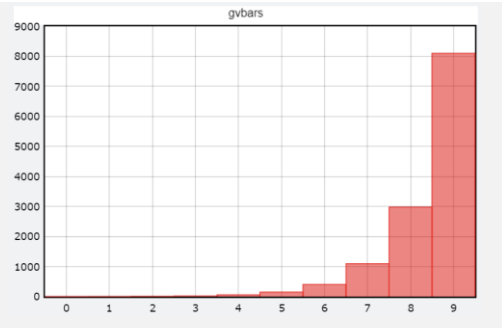
g = graph(title='gvbars') plot1 = gvbars(graph=g, color=color.red) for x in range(10): plot1.plot(x,exp(x))
ghbars – Horizontal Bars
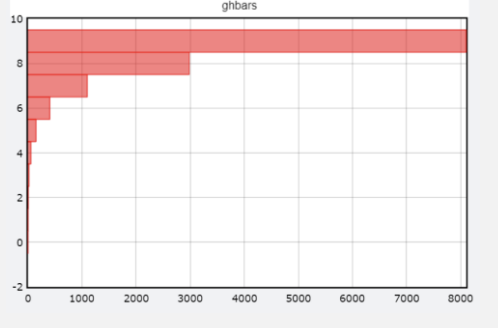
g = graph(title='ghbars') plot1 = ghbars(graph=g, color=color.red) for y in range(10): plot1.plot(exp(y),y)
Moving Graph
plotting 애니메이션을 생성하려면 rate(#)를 사용하여 plotting을 지연시킨다. 또한 scroll=True를 설정하고 graph()에 xmin, xmax를 지정한다.
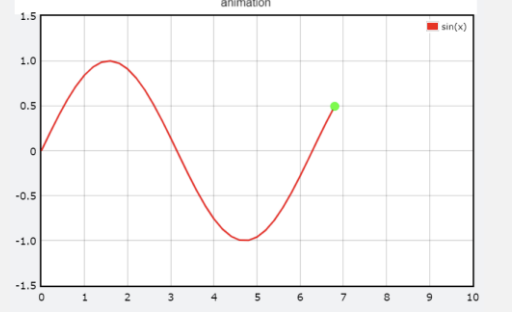
g = graph(title='animation', scroll=True, xmin=0, xmax=10) plot1 = gcurve(graph=g, color=color.red, label="sin(x)", dot=True, dot_color=color.green) for x in range(0,20,0.2): rate(10) plot1.plot(x, sin(x))
https://www.glowscript.org/docs/VPythonDocs/graph.html
VPython Help
In this section we describe features for plotting graphs with tick marks and labels as shown above. Graphs can be log-log or semilog (see below). As you drag the mouse across the graph you will find options to read information off the graph. A graph is dif
www.glowscript.org
728x90
반응형
LIST
'Python Library > VPython' 카테고리의 다른 글
| [VPython] Math Functions (0) | 2022.01.18 |
|---|---|
| [VPython] Animations (0) | 2022.01.18 |
| [VPython] Graphs (1) (0) | 2022.01.17 |
| [VPython] Widgets (0) | 2022.01.17 |
| [VPython] Parameters (0) | 2022.01.13 |


