Python Library/Pandas
[Pandas] 타이타닉 생존자 분석
goatlab
2022. 10. 25. 19:01
728x90
반응형
SMALL
타이타닉 생존자 분석
https://www.kaggle.com/datasets/tedllh/titanic-train에서 csv 파일을 다운한다.
import numpy as np
import pandas as pd
import matplotlib.pyplot as plt

titanic_df = pd.read_csv('titanic_train.csv')
titanic_df
titanic_df['Survived'].groupby(titanic_df['Sex']).mean()Sex
female 0.742038
male 0.188908
Name: Survived, dtype: float64titanic_df.pivot_table(index=['Sex'])['Survived']Sex
female 0.742038
male 0.188908
Name: Survived, dtype: float64titanic_df.pivot_table(index=['Pclass'], aggfunc=np.sum)['Survived']Pclass
1 136
2 87
3 119
Name: Survived, dtype: int64titanic_df['Survived'].groupby(titanic_df['Pclass']).sum()Pclass
1 136
2 87
3 119
Name: Survived, dtype: int64ages = []
for index, row in titanic_df.iterrows():
ages.append((row['Age']//10) * 10)
titanic_df['ages'] = ages
titanic_df['Survived'].groupby(titanic_df['ages']).sum().sort_values(ascending=False)ages
20.0 77
30.0 73
10.0 41
0.0 38
40.0 34
50.0 20
60.0 6
80.0 1
70.0 0
Name: Survived, dtype: int64titanic_df['Survived'].groupby(titanic_df['ages']).sum().plot(kind='bar')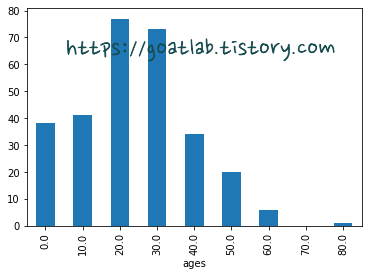
def age_to_ages(df):
    return (df['Age']//10) * 10

titanic_df.apply(age_to_ages, axis=1)
0 20.0
1 30.0
2 20.0
3 30.0
4 30.0
...
886 20.0
887 10.0
888 NaN
889 20.0
890 30.0
Length: 891, dtype: float64728x90
반응형
LIST